Relative Strength Index (RSI), developed by J. Welles Wilder, is used to analyze market buying and selling intentions and strengths by comparing the average closing gains and losses over a period, thus forecasting future market trends.
The Relative Strength Index (RSI), developed by J. Welles Wilder, is a momentum oscillator that measures the speed and change of price movements. RSI oscillates between 0 and 100. Traditionally, RSI is considered overbought when above 70 and oversold when below 30. Signals can be generated by looking for divergences and swing failures. RSI can also be used to identify overall trends.
How RSI Works
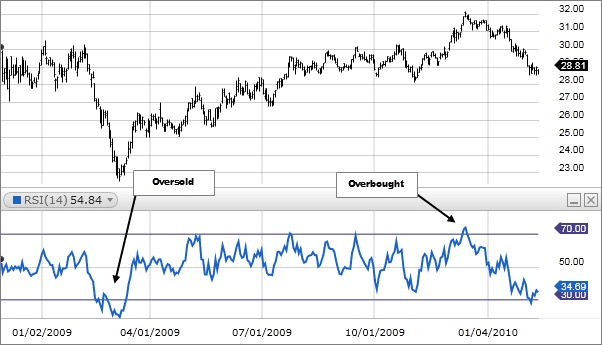
RSI is considered overbought when above 70 and oversold when below 30. If necessary, these traditional levels can be adjusted to better fit market trends. For instance, if the market frequently reaches an overbought level of 70, you may need to adjust this level to 80.
Note: In strong trends, RSI may remain in overbought or oversold conditions for an extended period.
RSI often forms chart patterns that may not appear on the underlying price chart, such as double tops and double bottoms and trendlines. Additionally, look for support or resistance levels in RSI.
In an uptrend or bull market, RSI tends to stay within the 40 to 90 range, with the 40-50 area serving as support. In a downtrend or bear market, RSI tends to remain within the 10 to 60 range, with the 50-60 area acting as resistance. These ranges may vary based on RSI settings and the strength of the market's underlying trend.
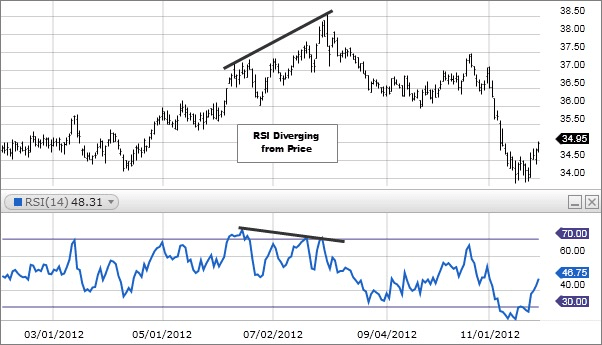
If the underlying price makes new highs or lows without confirmation from RSI, this divergence may indicate a price reversal. If RSI creates a lower high and then moves down below the previous low, a top swing failure occurs. Conversely, if RSI forms a higher low and then moves up above the previous high, a bottom swing failure occurs.
When it drops below 30, do not buy immediately; wait to observe for any signs of stabilization. When the line breaks back above 30, check EMA, candlestick patterns, etc., to determine if a long position can be opened. For example, if the price is close to EMA and a doji candlestick appears, wait for the line to continue moving up, ideally reaching the oversold area.
The market generally uses 6 days as the ultra-short-term benchmark and 14 days as the short-term benchmark, corresponding to the RSI (14) range: 25 - 75.
RSI Application Principles
👉 Due to the limitations of the calculation formula, the value of the strength indicator remains between 0 and 100, regardless of price changes.
👉 A strength indicator above 50 indicates a strong market, while below 50 indicates a weak market.
👉 The strength indicator generally oscillates between 70 and 30.
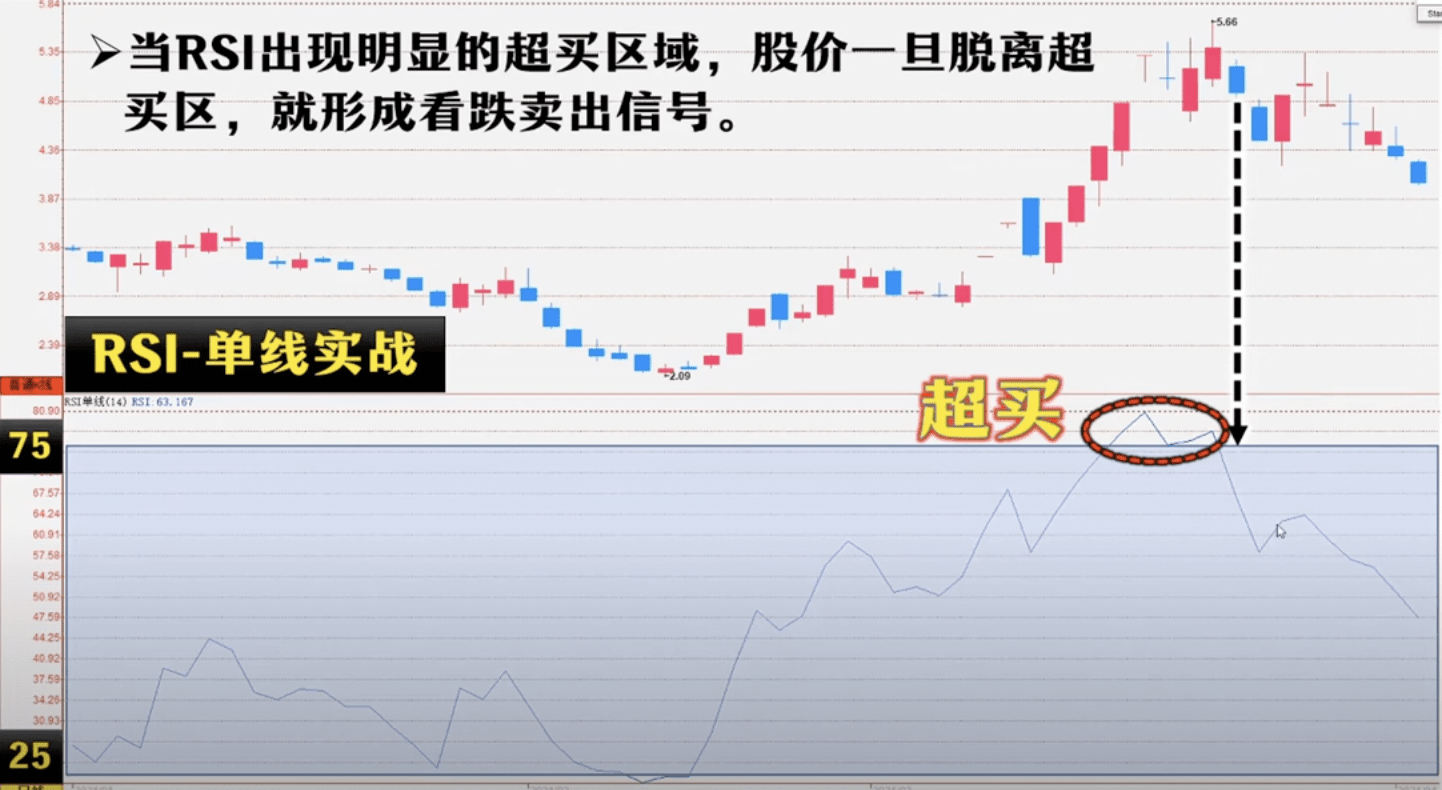
👉 When the 6-day indicator rises to 80, it indicates that the market is overbought. If it continues to rise above 90, it indicates a serious overbought warning zone, and the price is likely forming a top, with a high probability of reversing in the short term.
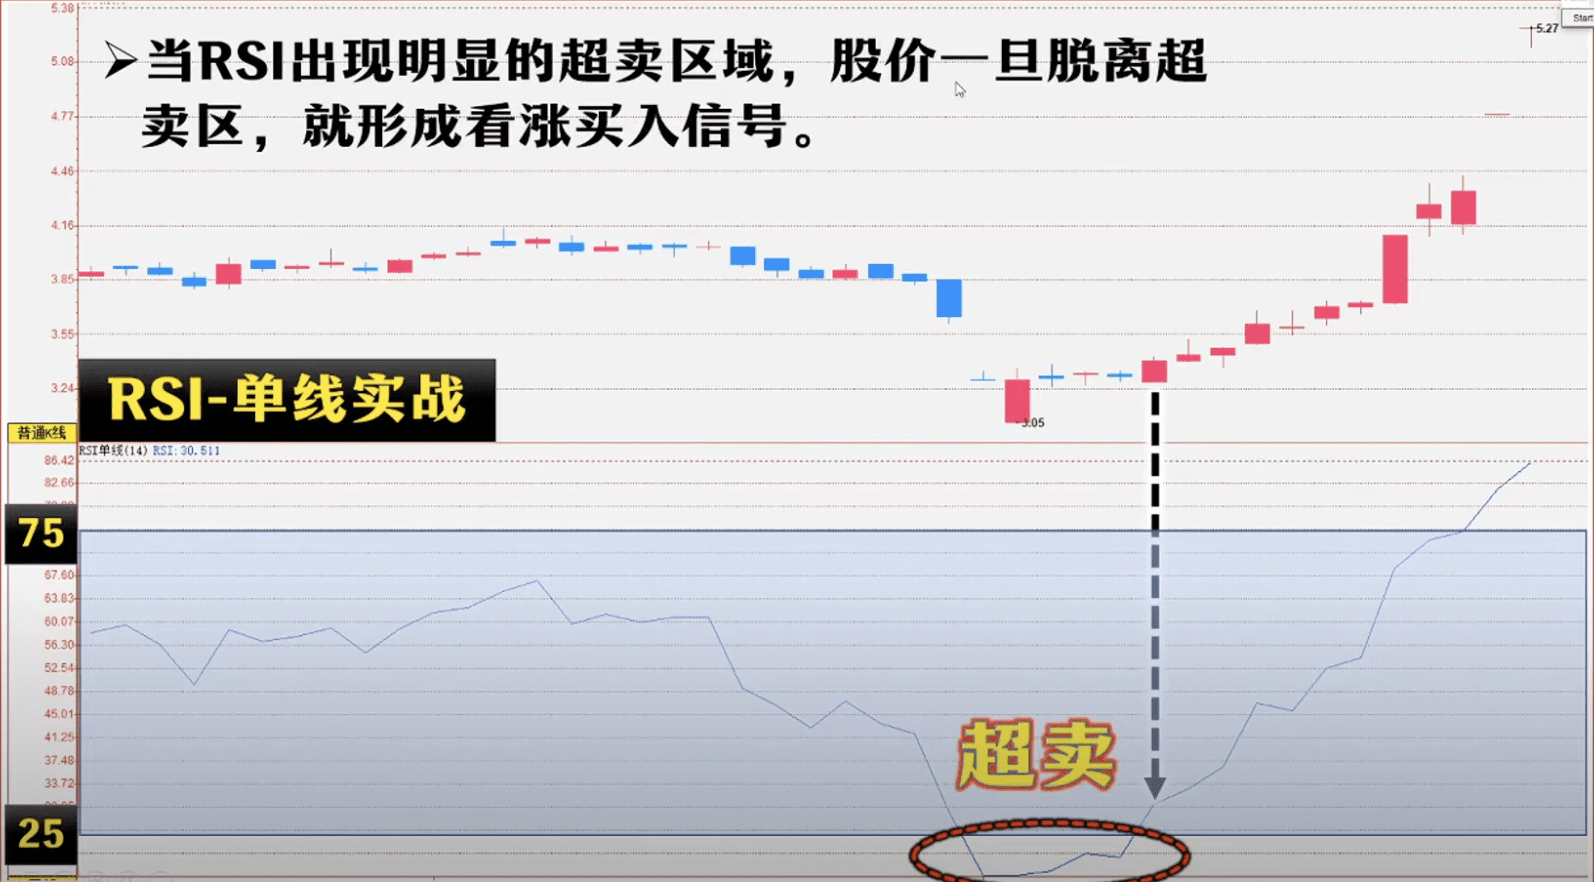
👉 When the 6-day strength indicator falls to 20, it indicates that the market is oversold. If it continues to fall below 10, it indicates a serious oversold area, where the price is likely to rebound.
👉 The overbought and oversold values vary for different types of stocks.
Stocks that fluctuate frequently usually have higher overbought values (90 to 95) and lower oversold values (10 to 15).
For more stable stocks, overbought values are lower (65 to 70), and oversold values are higher (35 to 40).
Therefore, before taking buy/sell actions on a stock, we must first identify its overbought/oversold levels. To measure a stock's overbought/oversold levels, we can reference its RSI records over the past 12 months.
👉 The determination of overbought and oversold ranges also depends on two factors.
The first is the characteristics of the market.
A stable market with little fluctuation generally defines overbought as above 70 and oversold as below 30.
In a more volatile market, overbought can be defined as above 80 and oversold as below 20.The second is the time parameter taken when calculating RSI.
🔥 For example, for a 9-day RSI, overbought can be defined as above 80 and oversold as below 20.
🔥 For a 24-day RSI, overbought can be defined as above 70 and oversold as below 30.
🔥 It should be noted that overbought or oversold conditions do not themselves constitute entry signals.
🔥 Sometimes, when market changes are too rapid, RSI can quickly exceed normal ranges, causing the overbought or oversold conditions to lose their warning signal effectiveness for entering or exiting the market. For instance, in the early stages of a bull market, RSI often quickly enters the area above 80 and stays there for a considerable time, but this does not indicate that the upward trend is about to end. On the contrary, it is a sign of strength.
🔥 Only in the late stages of a bull market or during a bear market is overbought considered a more reliable entry signal.
🔥 For this reason, it is generally not advisable to take buy or sell actions as soon as RSI enters an abnormal area. It is better to wait for the price itself to also signal a reversal before trading. This way, one can avoid traps similar to the aforementioned RSI entering the overbought area but not immediately returning to normal.
🔥 In many cases, a good buy/sell signal is when RSI enters the overbought or oversold area and then crosses back through the overbought or oversold line into the normal area. However, price confirmation is still necessary to take actual action. This confirmation can be:⭐ Breakthrough of trendlines;
⭐ Breakthrough of moving averages;
⭐ Completion of a certain price pattern.
👉 The strength indicator often shows leading signals of future market trends compared to stock prices or indices, meaning the strength indicator may rise before the stock price or index does, or fall before the stock price or index declines. This characteristic is most apparent at price peaks and troughs.
When the strength indicator rises while the stock price falls, or when the strength indicator falls while the stock price rises, this situation is known as 'divergence.'
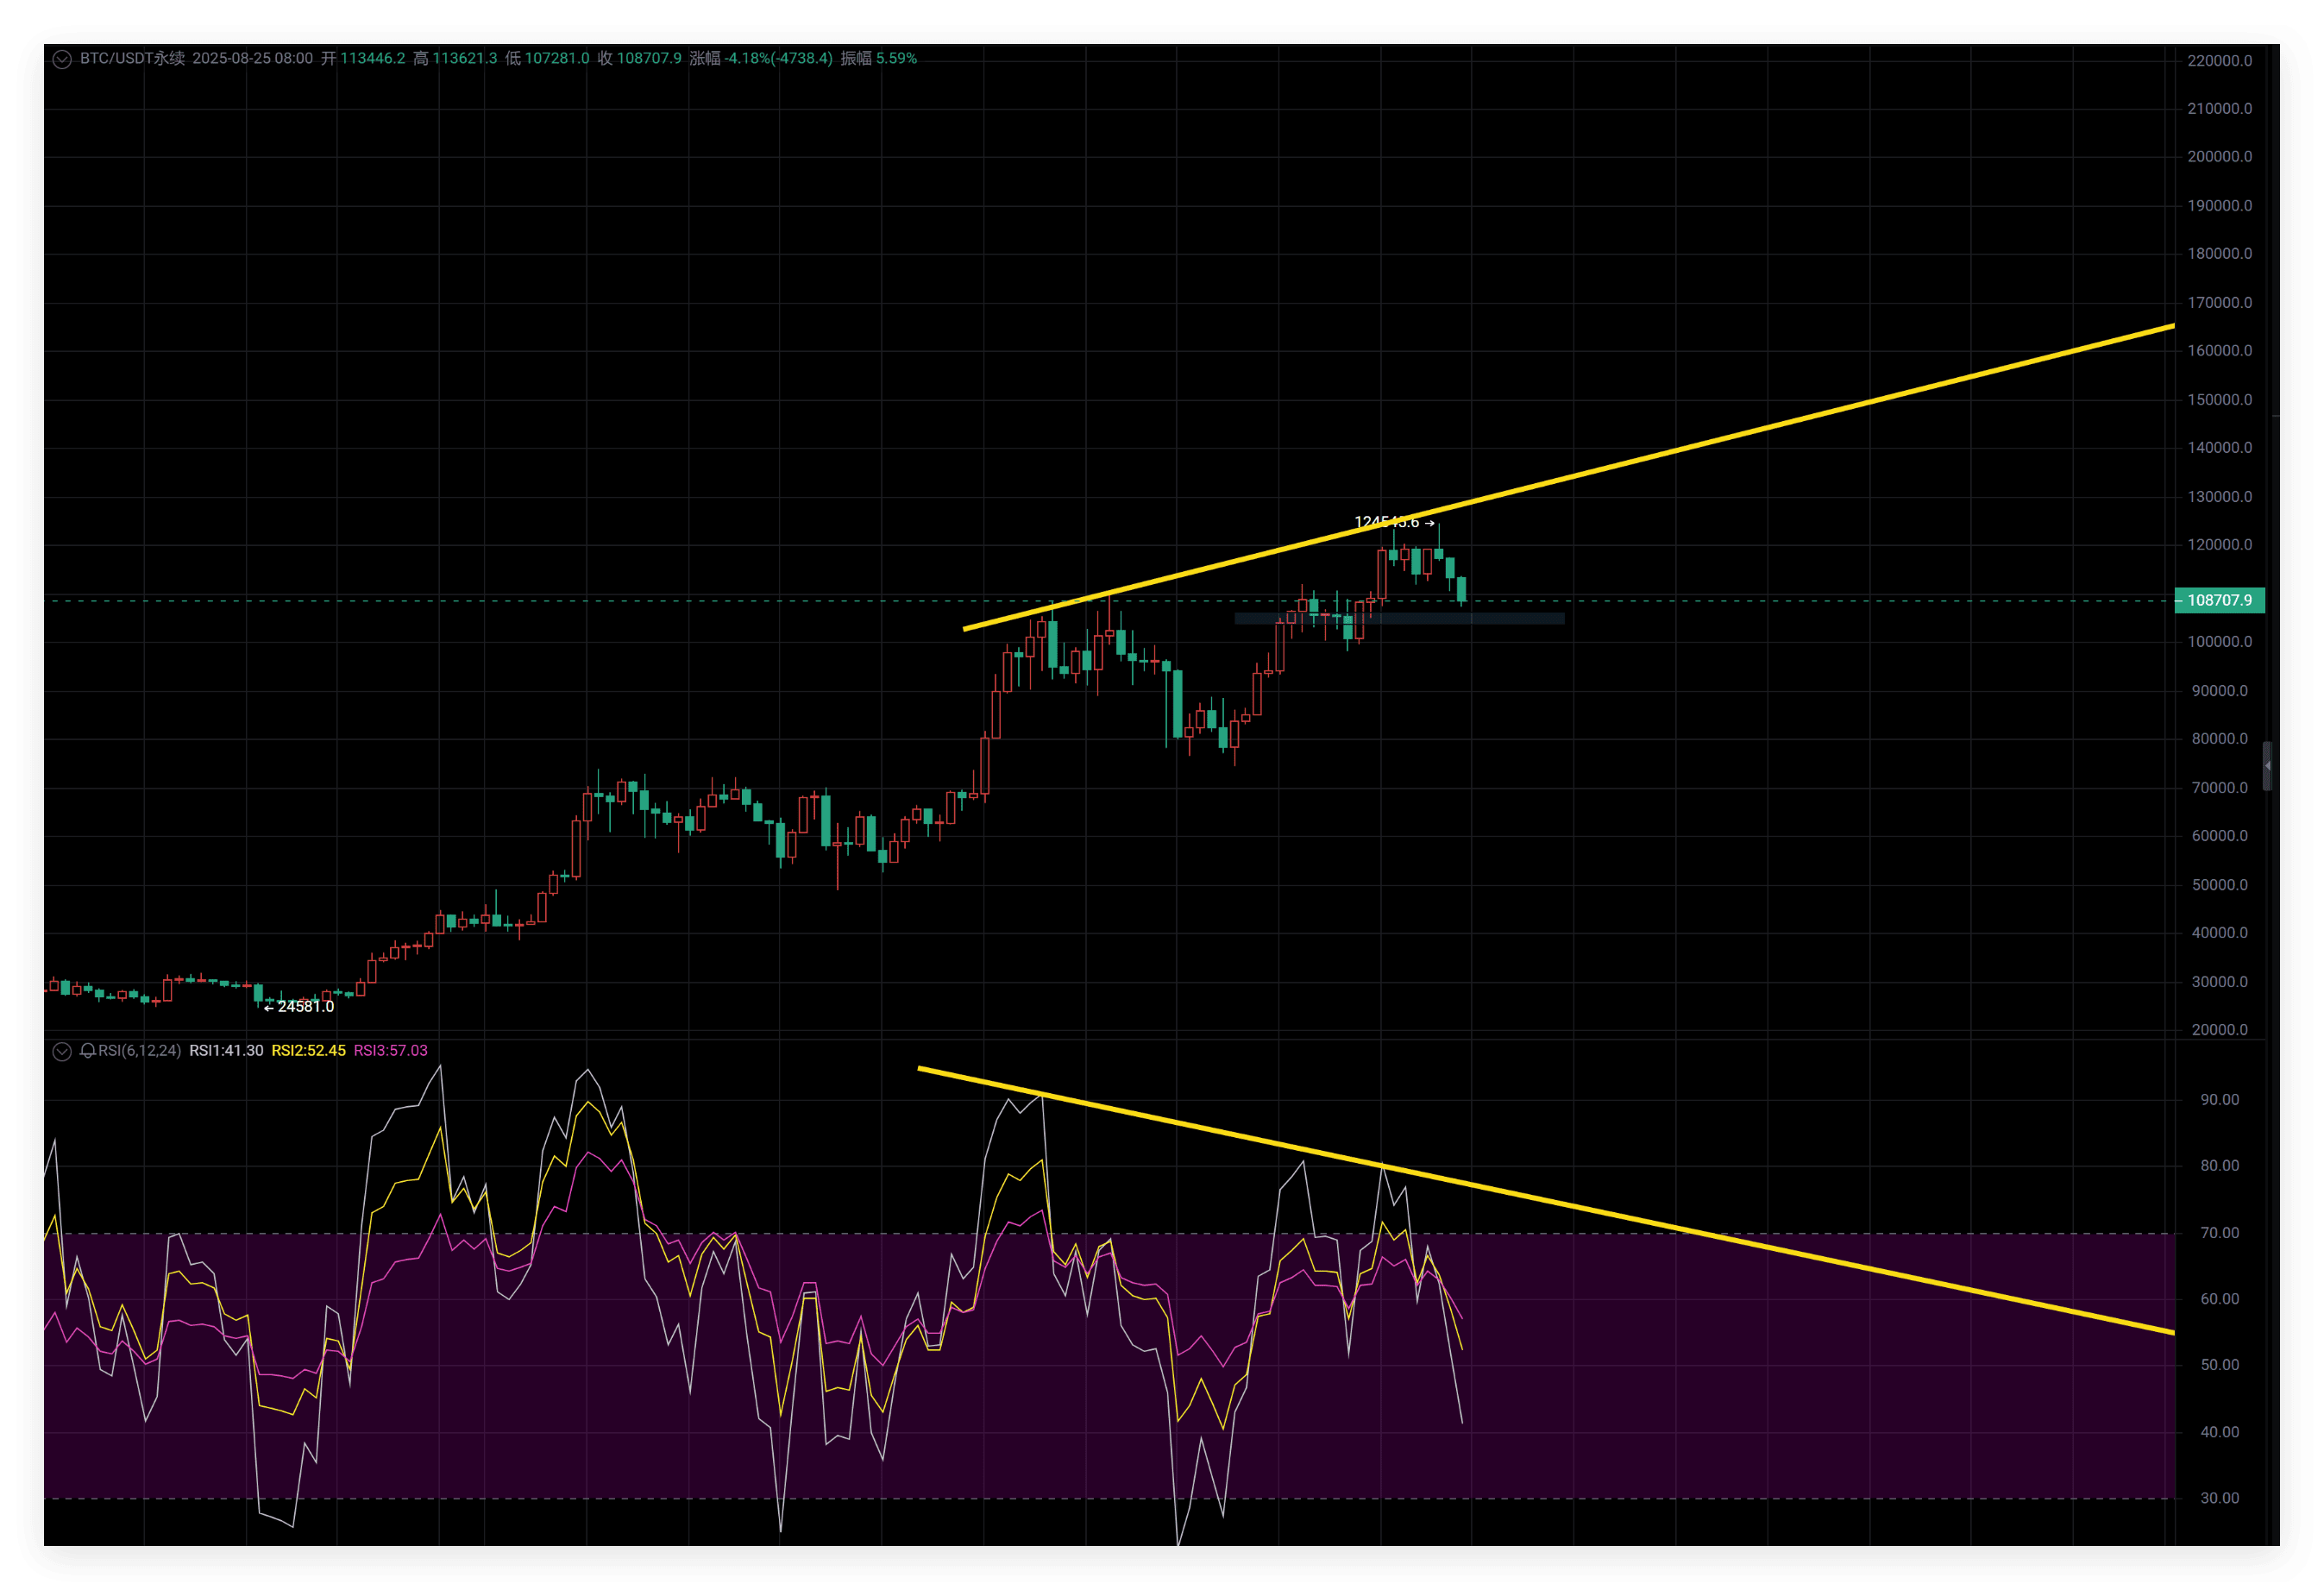
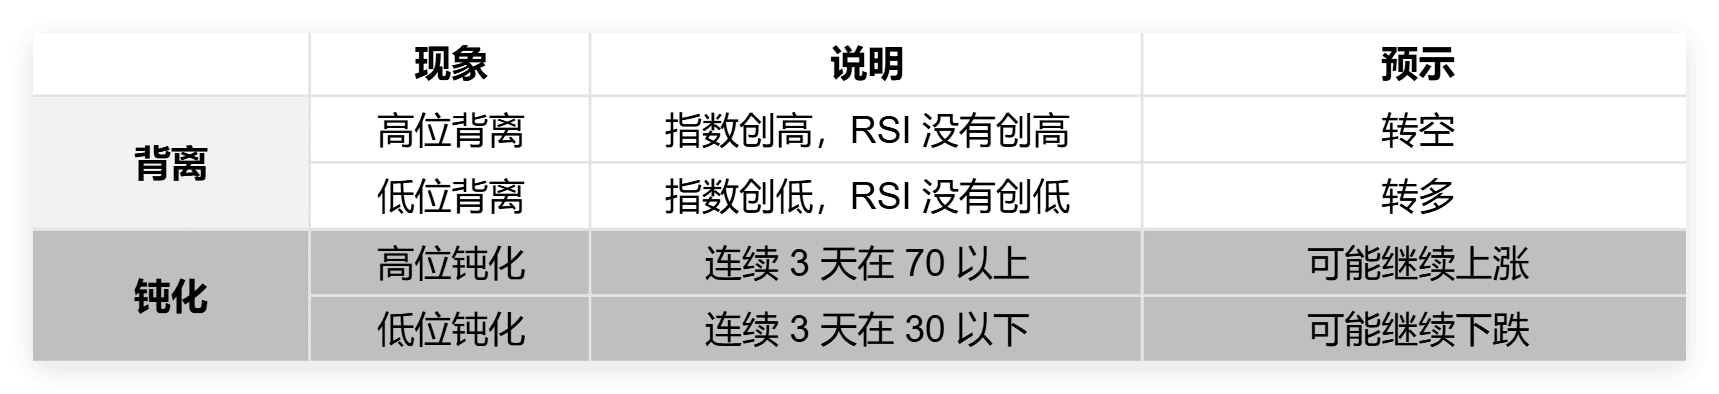
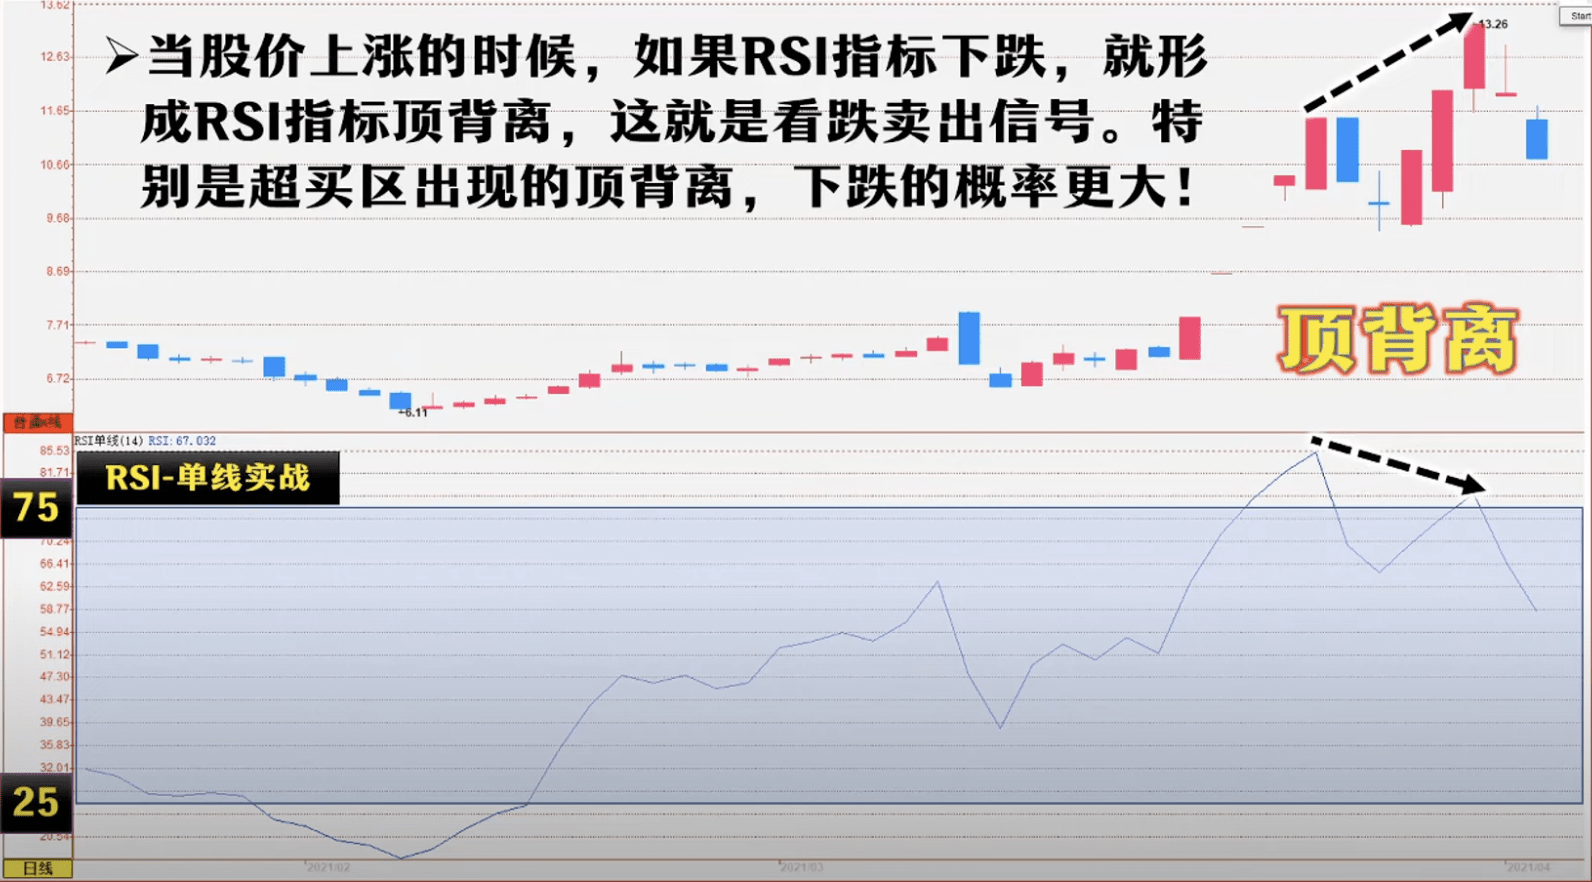
🔥 When RSI is between 70 and 80, and the price breaks the top while RSI cannot, this forms a 'top divergence.'
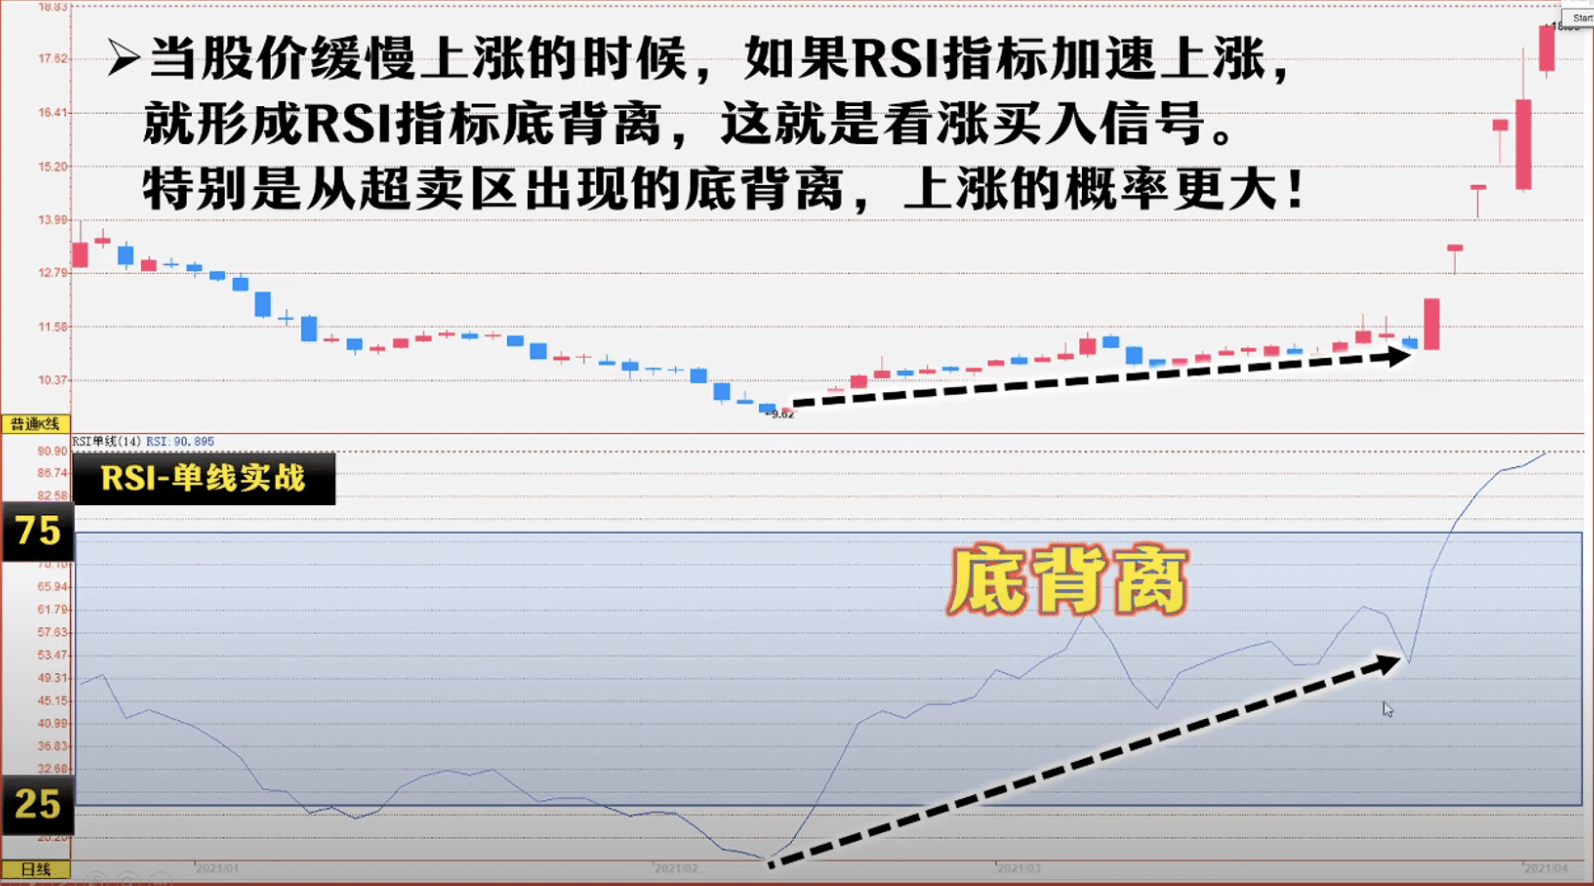
🔥 When RSI is between 30 and 20, and the price breaks the bottom while RSI cannot, this forms a 'bottom divergence.'
🔥 This divergence phenomenon between the strength indicator and price movements is often seen as a signal that the market is about to undergo a significant reversal.Like overbought and oversold conditions, divergence does not constitute an actual sell signal; it merely indicates that the market is in a weak position.
🔥 Actual investment decisions should only be made after the price itself confirms a reversal.
🔥 Although this confirmation process may cause investors to lose some profits when a reversal truly occurs, it can prevent premature selling decisions when the market does not reverse later.
🔥 Relatively speaking, this kind of mistake can cause greater losses for investors, as sometimes the market may temporarily lose momentum and then regain it without a significant directional change in price.
RSI Evaluation
👉 The Relative Strength Index (RSI) can show whether the market is oversold or overbought, suggesting that prices may peak and decline or bottom and recover. However, the RSI serves only as a warning signal and does not guarantee that the market will move in this direction, especially during periods of sharp market fluctuations, where oversold can still be oversold, and overbought can still be overbought. At such times, it is essential to reference other indicators for comprehensive analysis and not rely solely on the RSI signals for trading decisions.
👉 Divergence signals are often historical and may not result in market reversals even after they occur. Sometimes, a divergence must appear once or twice before a true reversal takes place, so continuous analysis of historical data is necessary to improve experience in this area.
👉 In a bull market, RSI hovers between 40 and 60, occasionally breaking through resistance and pressure lines, but with no actual change in price levels.
👉 More applicable to time frames of one hour and above, making it easier to judge medium to long-term trends. Additionally, RSI does not provide clear indications of the magnitude of price movements and should be used as a supplementary tool, not for direct trading guidance. The trendlines drawn in RSI serve as early warning signals; hence, the first breakout of a trendline may not provide a good buying or selling opportunity. However, in the subsequent movements after the trendline breakout, the usefulness of the drawn trendline will increase (typically, when approaching the drawn trendline again, it can provide strong support or resistance).
🧧🧧🧧 Other supplements to be updated


