Having been in the cryptocurrency space for ten years and trading professionally for six years, over 3100 days, I have experience with long-term, short-term, ultra-short, and swing trading. I have a lot of say on this issue.
I have always said that mastering a skill requires the 10,000-hour rule; with eight hours a day and more than 200 days of review a year, it takes nearly five years, just to establish a foundation for stable profits. There will definitely be big pitfalls within ten years, so to be safe, do not place more than your capacity within that time frame.
Many experts who have traded from tens of thousands to hundreds of millions have simply used large contract sizes, but many have also perished in a bear market; it's just that you don't know it. Human nature, in the face of large trends, often makes people lose their ability to make correct judgments.
In the cryptocurrency space, there are some obscure knowledge or little tricks that, although unremarkable, are actually quite important. Today, let's talk about a few of them:
Cost averaging is not as simple as it seems.
For example, if you invest 10,000 USDT when the price is 10 USDT and later the price drops to 5 USDT, then you add another 10,000 USDT. At this point, your average cost is 6.67 USDT, which is not the 7.5 USDT that many people think. This situation is common in the market, and understanding this cost calculation is quite helpful for managing positions.
The compounding effect can be quite daunting.
If you have 100,000 USDT and earn 1% daily, you can stop. If you can persist for a year with 250 trading days, your assets could grow to 1.3232 million USDT by the end of the year. Continue for another two years, and your assets could exceed 10 million. Of course, this is based on stable returns, and the difficulty lies in how to maintain this compounding growth.
Probability, take profit and stop loss, there are subtleties here.
Assuming you have a 60% chance of winning, earning 10% each time and losing 10% as a stop loss. This way, after 100 operations, your total return rate can reach 300%. But the premise is that you must strictly adhere to your trading plan and not be swayed by market fluctuations, especially during times of high market volatility, you must remain calm.
Greed is the biggest stumbling block.
For example, if you start with 10,000 USDT and earn 10% each time, after 49 days your assets could exceed 1 million, after 73 days over 10 million, and after 97 days who knows, maybe even over 100 million. But in reality, very few people can achieve this because most cannot control their greed and end up failing. This is also why many traders make money but cannot keep it.
Contract trading and position management.
When trading contracts, position and capital management are extremely important. Many people like to use 20%-30% of their capital to open positions, but I personally prefer to use only 2%-5%, then leverage 20 times. This way, the risk is controllable, and I won't lose my composure due to large fluctuations.
Seven iron rules for trading in the cryptocurrency space!
1. For strong cryptocurrencies that have dropped at a high level for nine consecutive days, be sure to follow up in a timely manner.
2. Any cryptocurrency that has risen for two consecutive days must be promptly reduced in position.
3. Any cryptocurrency that rises more than 7% should have further opportunities for a rise the next day; you can continue to watch.
4. Strong bullish coins must wait until the pullback is over before entering.
5. If any cryptocurrency has been stagnant for three consecutive days, observe for another three days; if there is no change, consider switching coins.
6. If any cryptocurrency fails to recover the previous day's cost price the next day, exit in a timely manner.
7. In the rising ranking list, where there are three, there must be five, and where there are five, there must be seven. Cryptocurrencies that rise for two consecutive days should be bought on dips, and the fifth day is usually a good selling point.
There is a 'foolproof' way to trade cryptocurrencies, following the trends is very simple! Share it with those who see this article.
Do you know how to trade using the best fractal trading strategy? This fractal trading strategy will answer all your questions about fractals. You will learn step by step how to use this strategy to achieve stable profitable trading.
Today, we will delve into a strategy that uses the Bill Williams fractal indicator and Bill Williams Alligator.
Before we start using the fractal strategy to achieve profitable trades, I would like to introduce some background information about Bill Williams himself. This will help you understand the importance of these special indicators. It is also advisable to read about 'adding to positions' and 'reducing positions' in trading.
Overview: Mastering Bill Williams' fractal trading method.
Bill Williams was a well-known Wall Street trading master, previously a psychotherapist, and the founder of Profitunity Trading Group, with over 49 years of trading experience (1932-2019). His theoretical themes include the fractal structure of Elliott Waves, the Money Flow Index, and the Wise Trader Method.
Bill Williams had profound knowledge of the stock, commodity, and forex markets, which led him to develop many technical indicators, including the fractal trading pattern. These indicators include the Accelerator/Decelerator Oscillator, Alligator, Awesome Oscillator, Fractals, Gator Oscillator, and Market Facilitation Index.
Every indicator has its specific value. If you can understand the basic concepts of each indicator, they are all very useful tools in trading.
His market view is that if you want to make money through trading, you must be able to understand the basic structure of the market. You also need to understand the internal components of the market, which he calls 'dimensions'.
These 'dimensions' include the following aspects:
Fractal (phase space)
Area (a combination of relative energy and strength)
Momentum (relative energy)
Deceleration/Acceleration (relative strength)
Balance line (strange attractor)
There is much more to say about Bill Williams, but the most important point is that his market analysis and views are unique. Although some claim that these powerful indicators are outdated, in reality, they are still very effective when applied with the right strategy.
His indicators are defaulted on most trading platforms. These indicators are usually categorized and displayed under his name 'Bill Williams' or 'Williams'.
Release the power of 'Fractal Breakout': The key indicators for successful trading.
Bill Williams fractal indicator: How to use fractals in trading?
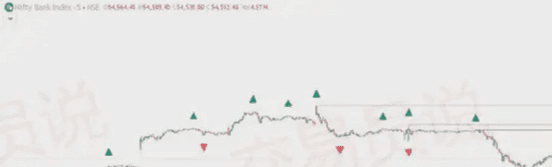
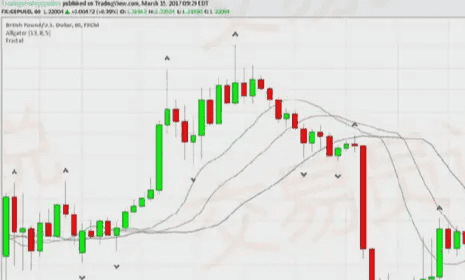
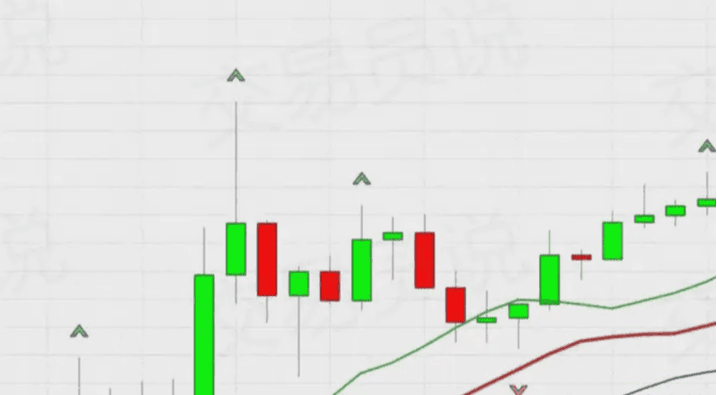
The fractals in the figure below are actually the arrows above or below the candlestick in the chart. These fractals form when five consecutive candlesticks are arranged in a specific way. You need to wait for the fifth candlestick to close to determine whether a high point or low point has occurred in this set of candlesticks.
We will further detail this fractal indicator and teach you how to use the 'Alligator Indicator'. You can find the fractal indicator on MT4 or other mainstream trading platforms. No need to download additional fractal indicator plugins, as they are already pre-installed on the platform.
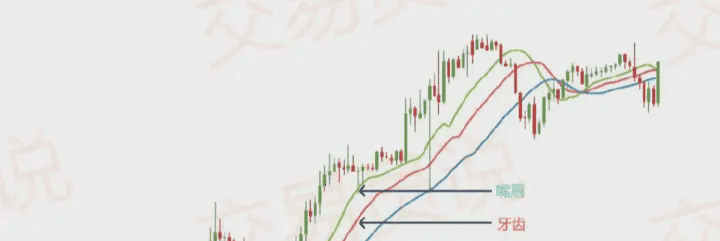
Bill Williams Alligator Indicator: How does it work? This indicator consists of 3 specific moving averages:
1. The 13-period moving average is referred to as 'jaw' (blue).
2. The 8-period moving average is referred to as 'teeth' (red).
3. The 5-period moving average is referred to as 'lips' (green).
We will delve deeper into this indicator later. The reason for naming these three lines is that we will frequently refer to them in the strategy.
Here is what the Alligator Indicator looks like:
The above indicators are just two of the five indicators developed by Bill Williams.
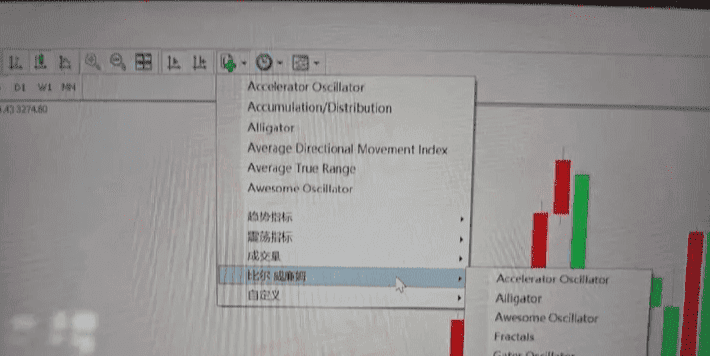
As shown in the above figure, these are all five powerful indicators that Bill Williams comes with on most trading platforms.
I do like each of these five indicators, but after extensive research and testing, I found that combining the Alligator line with the fractal indicator is not only the simplest way to use these indicators but also very powerful under the guidance of the right strategy.
Now, let's delve deeper into what a fractal structure pattern is.
What is a fractal in trading?
Williams' fractals are reversal points on the price chart, i.e., swing highs and swing lows. As mentioned, the fractal pattern consists of a structure made up of five consecutive candlesticks, where:
The middle candlestick is the highest point.
Or, the middle candlestick is the lowest point.
There are two candlesticks on each side of the middle candlestick. Please note that if the middle candlestick is the highest (or lowest) point among the five, the fractal indicator will display an arrow above (or below) it.
Note: According to Bill Williams' book (Trading Chaos), a fractal can also consist of a structure made up of 3 candlesticks, where the middle candlestick is the highest or lowest point among the three.
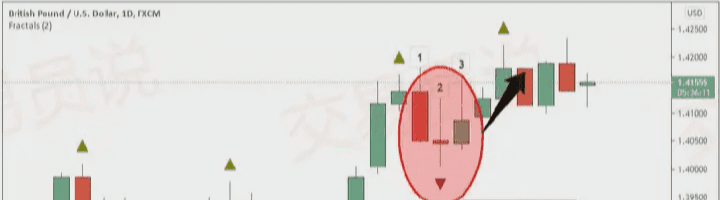
As a general rule, a fractal requires at least 3 candlesticks to form.
If you are a day trader or scalper, you should use a fractal structure made up of 3 candlesticks.
Here is an example of a low point fractal made up of 3 candlesticks:
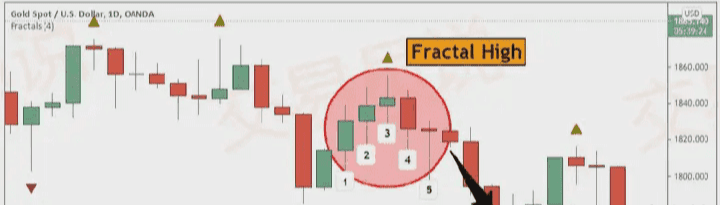
However, if you are a swing trader, we recommend using a higher fractal setting.
You can use any odd number as the fractal length, such as 5, 7, 9, etc.
Here is an example of a high point fractal made up of 5 candlesticks:
Although Williams' fractals rely more on visual recognition rather than the underlying mathematical formulas, for those who want to delve deeper, here is how to calculate fractals.
Understand the formula behind the fractal indicator.
The calculation of the fractal indicator includes multiple 'if conditions'.
For a fractal swing high point, we use the following formula:
High(N) > High(N−2) and
High(N) > High(N−1) and
High(N) > High(N+1) and
High(N) > High(N+2)
For a fractal low point, we use the following formula:
Low(N)<Low(N−2) and
Low(N)<Low(N−1) and
Low(N)<Low(N+1) and
Low(N)<Low(N+2)
Where N represents the highest or lowest price of the current candlestick.
How to trade using the fractal indicator?
Simplifying fractal trading: A beginner's guide to the Bill Williams fractal indicator.
The basic fractal trading strategy is actually very simple.
On most trading platforms, the fractal arrows appearing above the price are green, indicating that a potential high point (swing high) is forming.
In this case, the high point of this candlestick may indicate a potential resistance level.
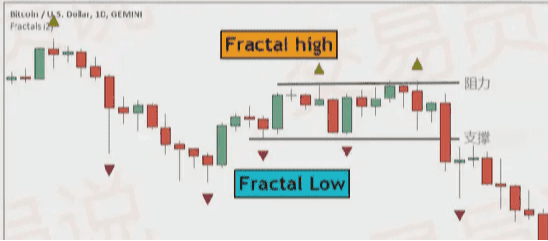
Conversely, the fractal arrows appearing below the price are red, indicating that a potential low point (swing low) is forming, or a critical price level is about to form.
In this case, the low point of this candlestick may indicate a potential support level.
This fractal trading system is indeed very effective in identifying short-term swing highs and lows.
Based on these trading principles, we developed a Bill Williams trading system that can issue low-risk entry signals.
Fractal trading strategy steps: Fractal trading technical guide.
Step #1: Apply both the 'Fractal Indicator' and the 'Bill Williams Alligator Indicator' simultaneously on the chart.
The first step is, of course, to load these important indicators onto your chart. As I mentioned earlier, these indicators are built into every trading platform I know, so this step should be very simple for you.
Once you have added them, your chart will look like this:
Step 2: Trade the Bill Williams fractal: Identify where the fractal appears (above or below the Alligator 'teeth').
Note **: In this example, we are adopting a buy trade strategy, so all the following rules apply to buy trades.
Now let's take a closer look at the true meaning of fractals.
A fractal represents a top or bottom. The most basic fractal indicator consists of at least five candlesticks. So when you see a fractal on the chart, it may mean one of the following situations is occurring:
At least five consecutive candlesticks form a fractal structure where the middle candlestick has the highest high, and there are two gradually lower highs on each side (forming a buy fractal).
When the middle candlestick shows the lowest low, with two gradually rising low points on each side, at least five consecutive candlesticks form a reversal fractal (i.e., forming a sell fractal).
Fractals may sometimes only appear with one candlestick on the right, but note that this fractal is not yet confirmed, as the price movement may break through that level. Therefore, to ensure a fractal remains on the chart, traders must wait for two more candlesticks to confirm the fractal.
Fractals have so-called 'high values' and 'low values', usually indicated by upward or downward arrows.
Next, we will explain this fractal breakout trading strategy in detail through specific chart examples.
The image above shows the unique Alligator Indicator. Now you need to pay special attention to the position of the fractal on the candlestick, especially when paired with this special indicator.
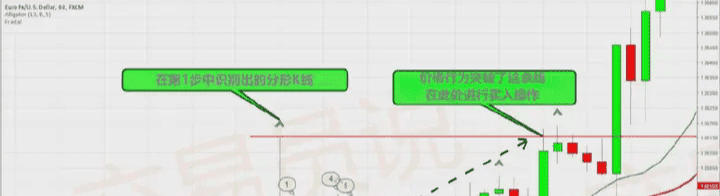
Here is a fractal example that we need to pay special attention to:
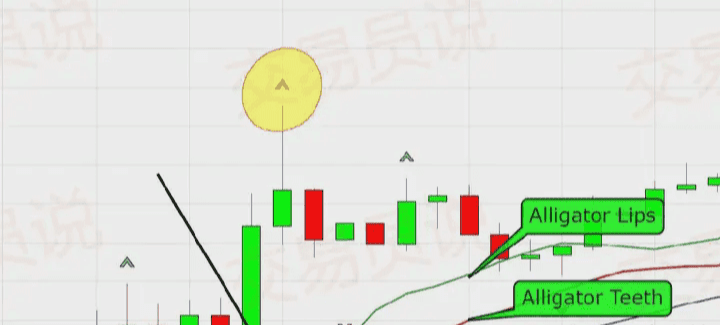
I have drawn a yellow circle on this specific ascending fractal. This ascending fractal appears on a certain candlestick, and this candlestick is above the red line (i.e., the 'Alligator teeth'). This is the first criterion for the 'Fractal Breakout' strategy.
In a buy trade, the fractal must appear on the candlestick above the red line (Alligator teeth).
What happens here is that this new fractal is higher than the previous fractal, thus forming an ascending fractal on the chart.
To enter Step 3 (buy trade), the fractal must be an ascending fractal and appear above the Alligator teeth line.
Step #3: The price trend must remain above the Alligator's teeth for five consecutive candlesticks (buy trade).
This is the 'magic' of the entire strategy.
In most cases, when a fractal like the one above appears, the price trend is still 'sideways'. That is, there has not been a real breakthrough within the recent timeframe. You can also combine this with the 'Breakout Triangle Strategy' for trading.
The reason for waiting for at least five consecutive candlesticks in this strategy is that this time period often indicates:
1. A pullback may be forming;
2. The price may be in a precursor to a reversal;
3. Or the price is still fluctuating in a flat sideways market.
In either case, if you are looking for a strong upward trend, these situations are not ideal signals.
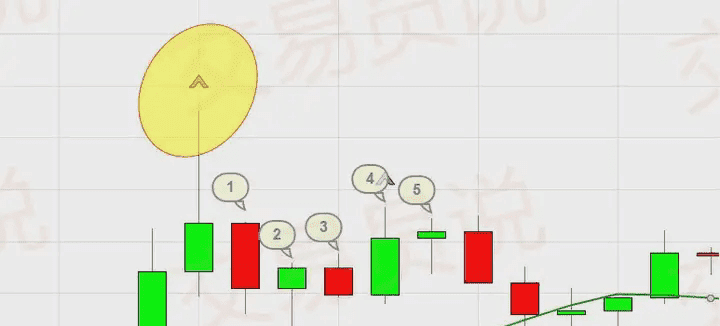
As you can see, during these five candlesticks, the price trend remains stable, with no significant up or down fluctuations. This is exactly what should be observed when using this strategy.
Before we continue to delve deeper into this strategy, let’s first clarify what situations can lead to a 'reset' of this strategy, rendering future buy trades invalid:
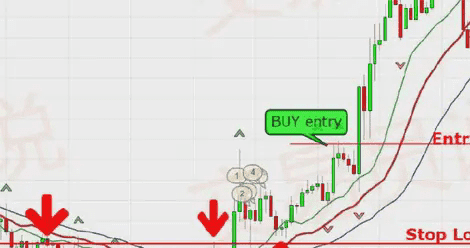
1. Reset condition: If a sell fractal appears below the Alligator teeth line before opening a position, it triggers a reset. As shown in the following figure:
2. As shown in the figure, if this situation appears in our previous buy trade example, we should consider that buy trade invalid and look for other opportunities. The reason is that this may signal a long-term bearish trend, which would not be wise if you intend to go long at this moment.
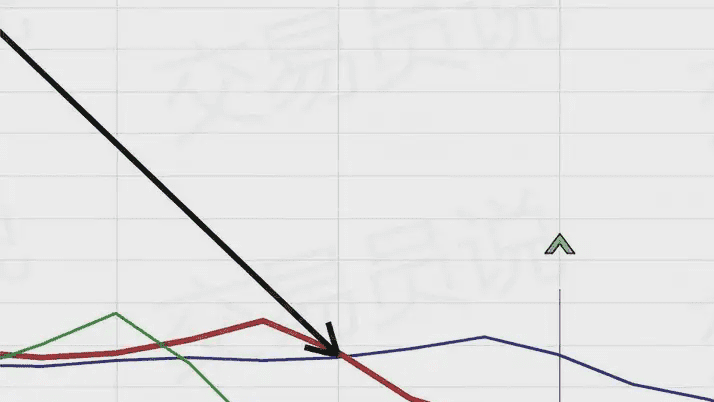
3. Reset condition: If any two lines of the Alligator indicator cross after the fractal candlestick confirmed in Step #1, it will also trigger a reset. As shown in the following figure:
Step 4: The price must break through the fractal candlestick defined in Step 1.
Once you see that five consecutive candlesticks have no significant declines and the price remains between the high points of the fractal candlestick and the Alligator teeth, you can consider placing an order to enter the market.
You can use pending orders to enter the market, or you can enter at market price when the conditions are met; both are acceptable, as the conditions satisfied are the same.
As illustrated below:
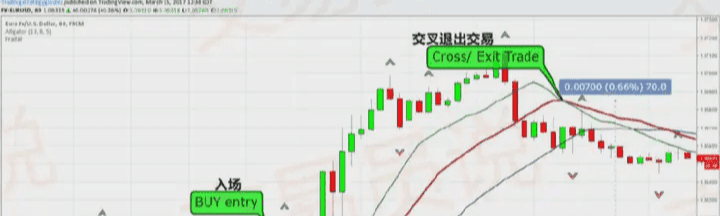
As you can see, I marked the fractal candlestick we initially identified. Next, five or more candlesticks appeared, and the prices did not drop back near the Alligator teeth line, nor did the Alligator lines cross, and ultimately the price broke through the high point of the fractal candlestick, triggering the trade.
Take profit target / stop loss setting.
Regarding take profit and stop loss, you can customize this strategy to a certain extent.
Take profit strategy:
Exit the trade when the two lines of the Alligator indicator cross.
This usually indicates that the Alligator is preparing to 're-sleep', and the price may reverse or enter a consolidation phase.
By following the above operations, this trade could gain a profit of 70 points.
Stop loss strategy:
Set the stop loss below the previous support/resistance area.
If the price trend is unfavorable to you and shifts to a bearish trend, this will provide you with the best opportunity to salvage your trade. Prices may 'bounce' from these areas and return to a bullish direction.
The above are all the entry conditions for buy trades. For sell trades, simply apply all the rules in reverse.
Here are the actual operational steps for the fractal trading strategy:
Fractal trading strategy practical steps: sell trade.
1. Step 1: Apply the fractal indicator and Bill Williams Alligator indicator on the chart.
2. Step 2: A descending fractal must appear below the Alligator teeth line, and the price must remain below the Alligator teeth line for five consecutive candlesticks.
3. Step 3: The price must break below the lowest point of the fractal candlestick confirmed in Step #1.
4. Step 4: Exit the trade when the two lines of the Alligator indicator cross.
Conclusion: Fractal Trading System
If you have been looking for an excellent trading strategy that can work with these indicators, these basic fractal trading techniques will point you in the right direction. While various strategies can be developed based on these indicators, what we prefer in practice is this combination strategy of the Bill Williams indicators.
Many people believe that all technical indicators are 'lagging' and rarely provide genuine profitable entry opportunities. The fractal trading strategy combines price action analysis, effectively supplementing these excellent technical indicators. Therefore, if you are a trader skeptical of indicators, you might as well try this strategy and let us know your results.
Frequently asked questions:
1. What is a fractal trading strategy?
The fractal trading strategy is a technical analysis tool that combines the Bill Williams fractal indicator with other technical indicators to identify market trends and potential entry and exit points.
2. How does the Bill Williams fractal indicator work?
The Bill Williams fractal indicator is used to identify potential reversal points in the market. Its structure consists of five consecutive candlesticks, where the middle candlestick has the highest high (or lowest low) and there are two lower highs (or higher lows) on each side, thus forming a fractal.
3. What technical indicators are used in the fractal trading strategy?
The key indicators of this strategy include: Bill Williams Fractal Indicator, Alligator Indicator, Awesome Oscillator, and Accelerator/Decelerator Indicator.
4. What common mistakes do traders make when using the fractal trading strategy?
Common mistakes include relying solely on one indicator for trading, failing to correctly identify market trends, and overtrading.
5. Can the fractal trading strategy be combined with other trading strategies or indicators?
Yes. It can be combined with technical tools such as moving averages, support and resistance levels, Fibonacci retracements, etc., to enhance the reliability of the strategy.
6. How can traders maximize profits using the fractal trading strategy?
Traders can maximize profits using the fractal trading strategy by combining indicators, accurately identifying trends, using other technical analysis tools to confirm signals, and following a clear trading plan.
7. What trading styles is the fractal trading strategy suitable for?
This strategy can be applied to day trading, swing trading, and long-term investing, and can be adjusted according to the trader's preferences and goals.
8. Can beginners use the fractal trading strategy?
Yes. Even novice traders with less trading experience can use it, but it may require more time to learn the basics of technical analysis and the use of related indicators.
9. What resources are available to help deepen the understanding and mastery of fractal trading strategies?
There are many resources available to help further learn and master fractal trading strategies, including books, online courses, trading communities, and forums.
10. Which platforms and brokers support fractal trading strategies?
Currently, most trading platforms and brokers support fractal trading strategies, including MetaTrader 4/5, TradingView, and Interactive Brokers. Traders should research different platforms and brokers to find the one that best meets their needs and preferences.
During this process, I summarized six important experiences that, while simple, are very practical.
Focus on strong cryptocurrencies: When trading cryptocurrencies, keep an eye on those that are performing strongly. If unsure, look at the 60-day moving average, enter or increase your position above the line, and exit promptly below it. This tactic works most of the time.
Avoid chasing highs: When the price of a cryptocurrency rises sharply by more than 50%, do not rush to buy in, as it can easily lead to panic. Buying at a lower level is often safer, carries less risk, and has greater potential for returns.
Identify rising signal: Before a major rise, there are usually some signs, such as the price fluctuating within a small range of 10% to 20%, but the trading volume is relatively small. At this time, you can gradually buy in at a low position, which often allows you to catch the upward trend.
Seize new hotspots: When new hotspots appear in the market, the first few days are usually very active. Following the footsteps of large funds during this time can often lead to easy profits.
Stay calm in a bear market: When a bear market arrives, keep your hands steady and ideally remain inactive for at least six months. Try to operate less in unfavorable market conditions and learn to rest, as this is the hallmark of a skilled trader.
Regularly review and adjust strategies: Review your operations weekly, not just looking at how much you earned, but evaluating whether your strategy was correct. If it was right, stick to it; if not, adjust it in a timely manner. Over a few months, the trading strategy will become increasingly robust.
Remember, success is not accidental; it belongs to those who are always prepared!
I only do live trading; the team also has positions to ride the waves.

