Every morning, I first drop the kids off at school, then come back to make breakfast. After eating, around 9:00, I turn on the computer and summarize the previous day's trading records into my trading system, looking for opportunities. I handle small amounts of trades, usually operating over ten cryptocurrency trades simultaneously. The busiest time is generally from 9:30 to 10:50 in the morning; in the afternoon, trading is light, and there aren't many opportunities, so I can operate from my phone. If the trading is light, I don't keep staring at the computer and give my eyes a rest.
In the afternoon, I usually go for a run in the park or forest, then pick up the kids from school, go home, and sometimes cook dinner myself or order takeout.
In the evenings, I generally just take care of some orders, spending more time sharing and answering questions. I also write reviews! If the trading volume is light or there is a one-sided decline, leading to a lack of trading opportunities, I drive to a remote area to fish. As long as there is mobile signal, I can trade on Binance while fishing, which is quite enjoyable. In short, it's about being free and easy.

In cryptocurrency investment, maintaining liquidity in the account, that is, 'having coins on the market, money in the account, and cash in the pocket,' is an important safeguard against market uncertainties. Never go all-in; allocate funds reasonably, and master risk control principles. This not only stabilizes the investment mindset but also effectively controls risks. Use idle funds for investment instead of borrowed capital, which is the foundation of investing. Master basic operational skills and thought processes, develop a habit of recording and summarizing, and treat the highs and lows of each operation as valuable experience to gradually cultivate the capability for information filtering and decision-making.
In addition to solid skills, I also adhere to the following six strict rules: grasp the elements of successful investing!
As long as retail investors do the following six points, turning 100,000 into 5 million is not difficult. These six points seem simple, but very few can actually achieve them. Here are the 'six iron rules' for guaranteed profits in the cryptocurrency world, helping you navigate the market with ease!
1. Understand stop-loss and take-profit. Trading cryptocurrencies is to profit from trading, not to hold forever. When the position trend goes wrong, decisively sell to avoid unnecessary losses. In the cryptocurrency world, do not be greedy when making money, and do not hesitate when facing losses.
2. Do not pursue absolute highs and lows. The market always has lower lows and higher highs, which ordinary people find difficult to grasp accurately. We only need to buy in the bottom area and sell in the top area to capture the overall trend.
3. Volume and price must perfectly match. Rising with no volume or new highs with no volume is often a signal of major players unloading or a sign of a weakening upward trend. It’s better to miss out than to chase the brightness, avoiding becoming the one left holding the bag.
4. React quickly. When the market presents positive news, swiftly identify the relevant sectors and projects. If you miss the first tier, timely position yourself in the second tier, and you can still achieve decent returns.
5. Learn to rest. The main upward trend of the cryptocurrency price is very short, while most of the time is spent in fluctuations or corrections. Catch the main upward trend; during other times, learn to rest to avoid losses from frequent trading.
6. A sharp drop is the biggest benefit. Market crashes often give rise to greater opportunities. Be greedy when others are fearful, and fearful when others are greedy. When the market crashes, do not panic; select quality assets to build positions timely and wait for a rebound.
Bitcoin has skyrocketed, reviving some of the previous trading strategies. The simplest and most straightforward may be the MACD trading strategy claimed to yield 400 times a year from the demigod of the cryptocurrency world.
To put it simply, it is just about finding opportunities for continuous MACD divergences.
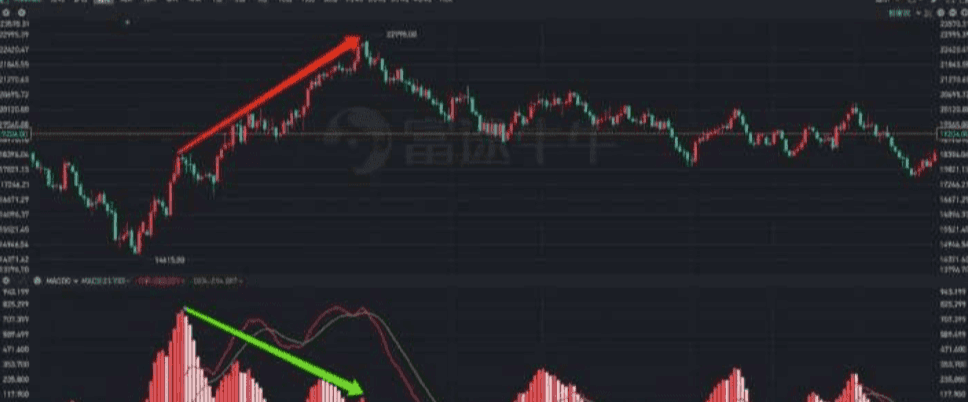
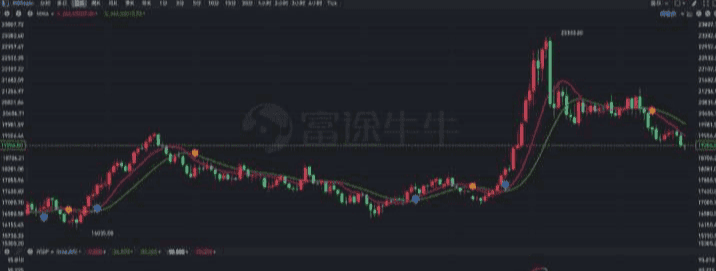
The above image is a good example, fully demonstrating the two core points of this trading strategy: continuity and divergence.
What constitutes continuity?
The MACD is above the zero axis, and after a peak, if it does not drop below the zero axis and rises again to form another peak, or if it drops below the zero axis and quickly crosses back above to form a peak, this is what is called continuity.
What constitutes divergence?
The peaks of MACD are gradually decreasing, while the stock price is gradually increasing. This means the trends of MACD and the stock price are inconsistent; this is what is called divergence.
Of course, inconsistent trends can be divided into two situations: if the indicator declines while the stock price rises, it is a top divergence; if the indicator rises while the stock price falls, it is a bottom divergence.
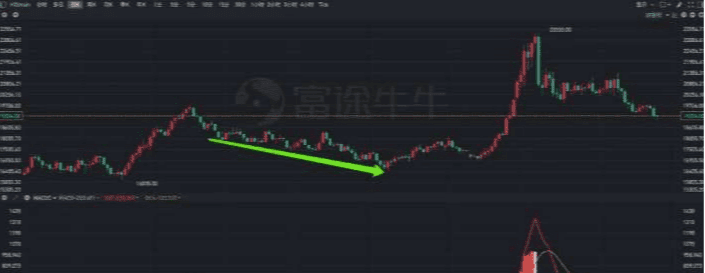
The above image is an example of top divergence. Similarly, in the Hang Seng Index, bottom divergence had already occurred before the market started on September 24.
The trading strategy of the demigod is to seek opportunities for continuous divergences in the MACD indicator.
First, modify the default first two parameters of MACD from 12 and 26 to 13 and 34, then look for continuous divergences with significant differences between peaks and troughs; short on top divergence, long on bottom divergence, and then apply stop-loss based on the ATR with a parameter of 13.
Causes of divergence
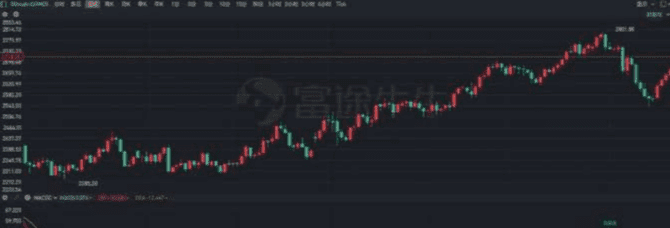
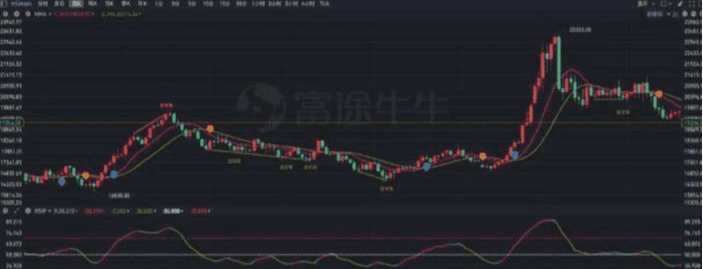
From the above two screenshots, trading short on top divergence and long on bottom divergence indeed presents great opportunities. Everyone can test this strategy on the assets they are interested in to see if it can capture some sizable opportunities.
In this process, two problems may arise. First, the MACD indicator that comes with the platform only has fast and slow lines and a histogram, and does not include the identification of divergences, making it very inconvenient to verify the validity of divergence signals when backtesting historical data; second, after backtesting, it is likely to find that divergence signals are quite effective, but bottom divergence is relatively more effective than top divergence.
How to solve the problem of identifying divergence signals, we will discuss later. Now let’s analyze the causes of divergence and why bottom divergence signals are more effective. #Musk plans to establish the American Party
First, let’s take a look at the code of the MACD indicator and analyze the construction logic of this indicator.
DIF: EMA(C, 12) - EMA(C, 26), COLORRED;
Indeed, the original MACD indicator is that simple. Implementing the so-called 'king of technical indicators' MACD requires only three lines of code.
In the first row, the difference between two different time period moving averages calculated from the closing price is displayed as a curve;
In the second row, calculate the average of the difference between the two moving averages from the previous step and display it as a curve;
In the third row, the difference between the two is magnified and displayed as a histogram.
Therefore, even if we haven't studied the design principles of the MACD indicator, we can analyze the causes of divergence just from its code.
If a top divergence occurs, meaning the peak of MACD is decreasing while the stock price is rising and reaching new highs, this indicates that the value of MACD is declining.
The value of MACD is derived from the difference between DIF and DEA, which indicates that the gap between DIF and DEA is narrowing.
And DEA is the average of DIF, which indicates that DIF is gradually decreasing or the increase is slowing down. Also, due to the smoothing effect of DEA, when the increase of DIF narrows, DEA still rises, causing the difference between the two to shrink or even reverse.
DIF is the difference between two moving averages of different periods. If DIF gradually decreases or the increase slows down, it indicates that the difference between the two moving averages is narrowing. The short-term moving average is sensitive, and the long-term moving average is smooth; therefore, as the difference narrows, we can consider the slope of the short-term moving average beginning to approach the slope of the long-term moving average.
When the slopes of the short-term and long-term moving averages begin to converge, it may be due to two reasons: the stock price has fallen or the increase has become smaller. The condition for top divergence is that the stock price is still rising and reaching new highs, so the narrowing difference indicates that the increase is shrinking, which means stagnation has occurred.
The same deduction process can lead to the conclusion that the cause of bottom divergence is that there is stagnation in the decline, meaning it is unable to fall further.
After a long period of volatility, once a trend is formed, it is difficult to reverse. After a top divergence, some profit-taking funds may exit, but those who did not believe at first and are just beginning to believe will gradually enter, and although the momentum has weakened, the trend remains. After a top divergence, there can still be top divergence, and the stock price may form even higher highs.
Similarly, after a bottom divergence, it is also possible to form a lower low. However, compared to rising prices, falling prices are often short-lived and steep, especially after several rounds of panic selling; people become numb to bad news, and when there's nowhere else to fall, the remaining participants are mostly strong holders. Coupled with the psychological advantage of buying at low prices, this often triggers a strong rebound, making bottom divergence signals more likely to realize.
Identifying divergence
When the stock price reaches a new high but the indicator does not, it is a top divergence, indicating that the strength of the bullish trend is weakening, and the market may experience a top reversal; when the stock price reaches a new low but the indicator does not, it is a bottom divergence, indicating that the strength of the bearish trend is weakening, and the market may experience a bottom reversal.
Since it is 'likely to reverse', it indicates a left-side trade. If trading contracts, it is understandable why the demigod can achieve such high returns with this strategy.
Of course, since it is left-sided, there may be situations where 'there are tops within tops, bottoms within bottoms, and divergences after divergences.' Therefore, the demigod's trading strategy particularly includes ATR-based stop-loss to avoid reverse trading contracts in strong trends, which could lead to total loss or even liquidation risks.
With both entry signals and stop-loss rules, logically, this is a relatively complete trading strategy. But the problem is, if one relies on the naked eye to identify situations of continuous MACD divergence, the efficiency may be very poor.
Although there are related indicators in TradingView to assist trading, there are few tools of this toolbox nature in domestic trading software. Most just have a flashy name, giving the illusion that one can make money just by trading based on indicator signals.
However, we all know that for different markets, different assets, and different time frames, the trading signals must be treated differently.
In a strongly trending market, the KDJ indicator may remain in the overbought or oversold zones; in a volatile market, moving average indicators may repeatedly cross bullish and bearish. If you rely entirely on a single signal, you may end up losing everything after some time.
Thus, technical indicators should actually be viewed as auxiliary tools, with their primary function being to enhance efficiency. For example, concerning continuous MACD divergences, if we can use technical indicators to achieve automatic recognition of this pattern, we can better seize such opportunities.
The identification of divergence has three key points: triggering mechanism, time range, and judgment method. In previous articles, we introduced a simple method for identifying divergence using MACD color changes.
This identification method is very simple; it uses MACD's bullish and bearish crossovers as the triggering mechanism, applies two crossovers as the time range, and judges whether divergence has occurred based on the trends of DIF and stock prices during crossovers.
This is actually a kind of opportunistic method. It may be barely usable in general situations, but if one wants to rely on the demigod's trading strategy to identify signals, that would clearly be incorrect.
For example, continuous top divergence refers to several consecutively decreasing peaks, and there is no retracement below the zero axis between peaks, or even if there is a retracement below the zero axis, it consists of only a few bars.
Therefore, its triggering mechanism is to first find a peak, then look back at the position of the last peak, check if there is a portion below the zero axis between the two peaks, and if there is, check if the number of bars below the zero axis exceeds the threshold, and finally determine if the two peaks are decreasing while the corresponding stock price is still rising.
Similarly, continuous bottom divergence requires first finding a trough, then looking back to the last trough to see if there is a portion above the zero axis between the two troughs. If there is, it is necessary to check if the number of bars above the zero axis exceeds the threshold, and finally determine if the two troughs are ascending while the stock price is still declining.
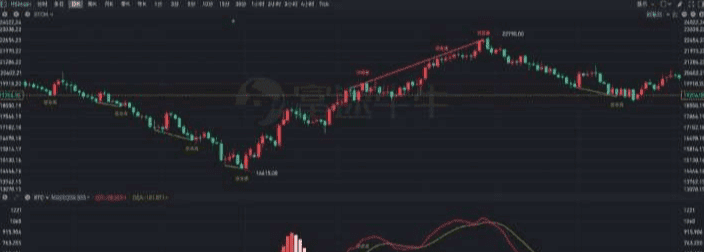
Comparing with the screenshot given at the beginning of the article, we no longer need to manually draw lines to measure whether continuous divergence has occurred. By using custom technical indicators, we can identify whether MACD has diverged and connect peaks and troughs on the sub-chart, while connecting the corresponding highest or lowest prices of MACD on the main chart, thus clearly identifying divergences.
Of course, since it is a custom indicator, the conditions for continuous divergence can be set according to personal preference, such as whether two or three consecutive peaks and troughs are needed, the number of bars below the zero axis between peaks, and how much the difference between consecutive peaks and troughs should be, all of which can be adjusted.
Identifying trends
A trading strategy based on divergence will enter the market when the trend has not been fully confirmed, exhibiting characteristics of left-side trading; thus, ATR-based stop-loss is indispensable as an important component of the demigod trading strategy.
However, we can completely combine other technical indicators to further reduce the potential risks brought by left-side trading. MACD measures the strength of trends, while the trends themselves can naturally be measured using moving average indicators.
Generally speaking, most people rely on the crossover of two moving averages (short-term and long-term) to identify trends. However, there is an age-old problem: if the two time parameters are too close, the two moving averages may cross frequently, resulting in a large number of invalid signals; if the time parameters are too far apart, the timing for entry and exit will be significantly delayed.
Thus, we can adopt this method: choose a preferred time parameter, and then select different moving average algorithms to get the fast and slow lines.
For example, we first calculate MA10 from the closing price, then calculate EMA10 from MA10, thus mimicking the calculation principles of DIF and DEA to obtain two fast and slow lines, and then formulate buy and sell signals based on the crossover of these two lines.
Of course, this method, compared to traditional dual moving averages, although it has only one time parameter, inevitably faces the issue of needing to filter out invalid signals.
The market is mostly in a state of volatility; therefore, we can use whether it is overbought or oversold as a filter for moving average crossover signals.
For example, when the double moving averages cross bullishly, if the RSI indicator is between 50 and 70 (above 70 is considered severely overbought, do not chase high) and is rising, it is considered an effective long signal; when the double moving averages cross bearishly, if the RSI indicator is between 30 and 50 (below 30 is considered severely oversold, do not chase low) and is falling, it is considered an effective short signal.
At the same time, further restrictions can be placed on the candlesticks. When going long, the lowest price must be above the fast line, and when going short, the highest price must be below the fast line. This way, the effects shown in the following figure can be achieved.
Optimization iteration
Thus, we have constructed a trading strategy using the most basic technical indicators: moving averages, RSI/KDJ, and MACD.
For those with ample patience who can trade contracts, options, and futures, pursuing a higher success rate, they can patiently wait for continuous MACD divergence signals to appear. Other traders can make short trades based on moving average crossover + RSI filter signals.
Moreover, the beginning of a market trend will inevitably trigger a crossover of the two moving averages, while the end of a market trend often forms a divergence in the MACD.
Therefore, combining them allows us to observe when to take profits based on the divergence signals after making long or short trades based on moving average crossover signals; after entering on the left side using divergence signals, we can then confirm on the right side using moving average crossover signals.
So, this is actually a complementary system, but there is still significant room for improvement in terms of signal prioritization, compatibility of short and long-term analysis, historical data backtesting, and parameter tuning.
We welcome all friends in the cryptocurrency community to provide more feedback during the use of indicators, so we can further optimize and iterate.
The current market is at a bottom formation phase. If you lack direction, remember to follow my lead; standing on the shoulders of giants can save you a decade of detours!
I only engage in live trading; the team is also on the lookout for positions to enter.


