📊 PNUT/USDT 4H Technical Analysis
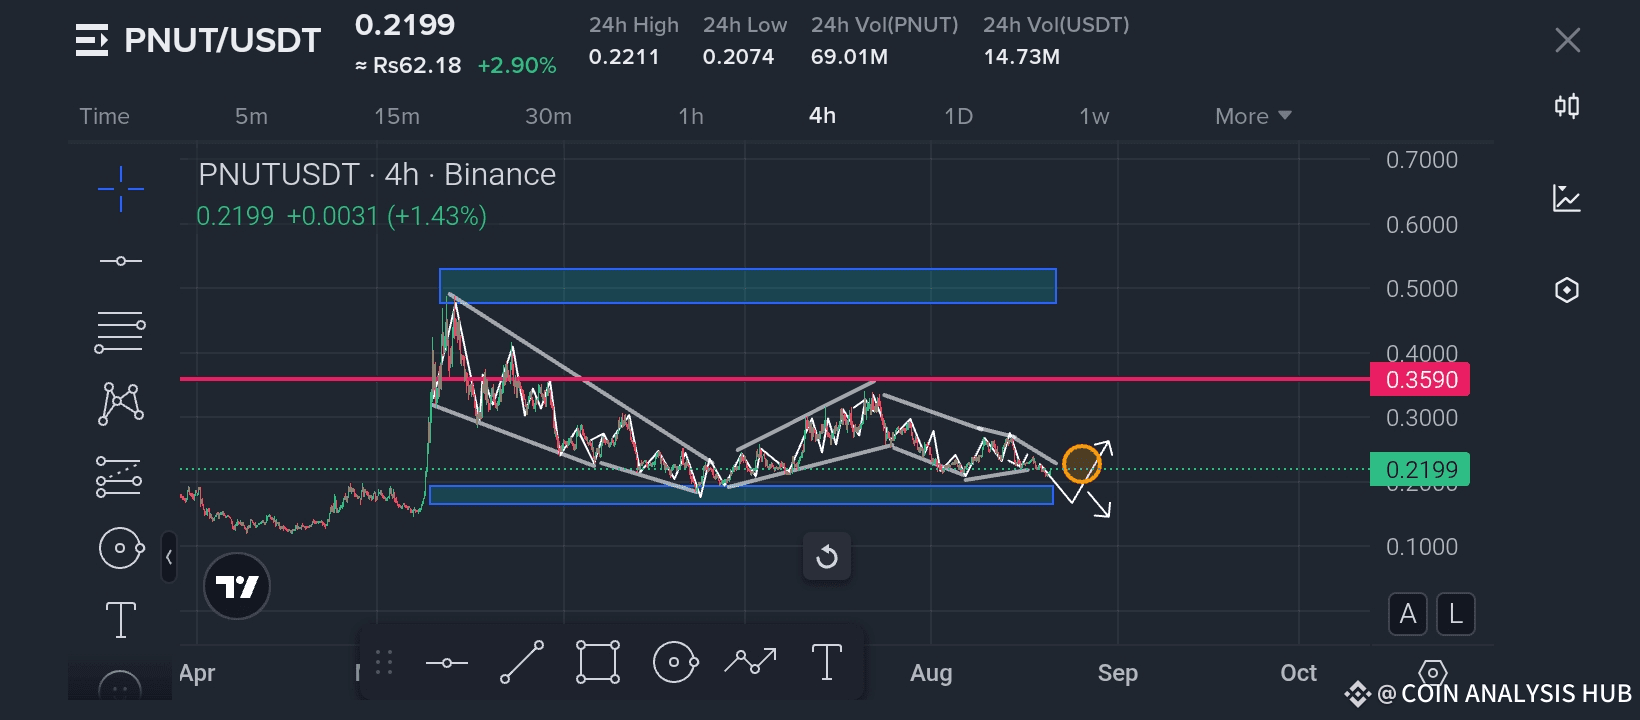
PNUT is currently trading at 0.2199 USDT, showing a slight recovery of +1.43%. The chart structure reveals some important technical signals that traders should carefully watch:
🔹 Descending Channel: Price has been consolidating inside a downward structure after a strong impulse move. This shows sellers are still in control, but the structure is tightening.
🔹 Strong Support Zone: Around 0.2000 – 0.2100 USDT (blue box), buyers have been consistently defending this level. If price holds above this, we could see a rebound attempt.
🔹 Major Resistance Level: The key resistance sits near 0.3590 USDT (red line). Bulls must break above this zone to confirm a reversal towards higher targets.
🔹 Pattern Outlook: The formation is showing a potential falling wedge, which is often a bullish reversal pattern if broken to the upside. However, a clean break below 0.2000 may lead to further downside continuation.
⚖️ Conclusion:
✅ Bullish scenario → Hold support and break out of wedge = possible push towards 0.3000 – 0.3590.
❌ Bearish scenario → Breakdown of 0.2000 = risk of testing lower demand zones around 0.1700 – 0.1800.
💡 Tip: Always wait for confirmation (breakout with volume) before entering, and manage your risk with proper stop-loss levels.
🔔 Do you think my analysis is right or wrong? Share your thoughts below 👇
If you like this analysis, don’t forget to drop a tip 💸 to support more updates for the community! 🚀
Best of luck 🤞 🍀 🤞