🚨 DOGE/USDT 4H Technical Analysis 🚨
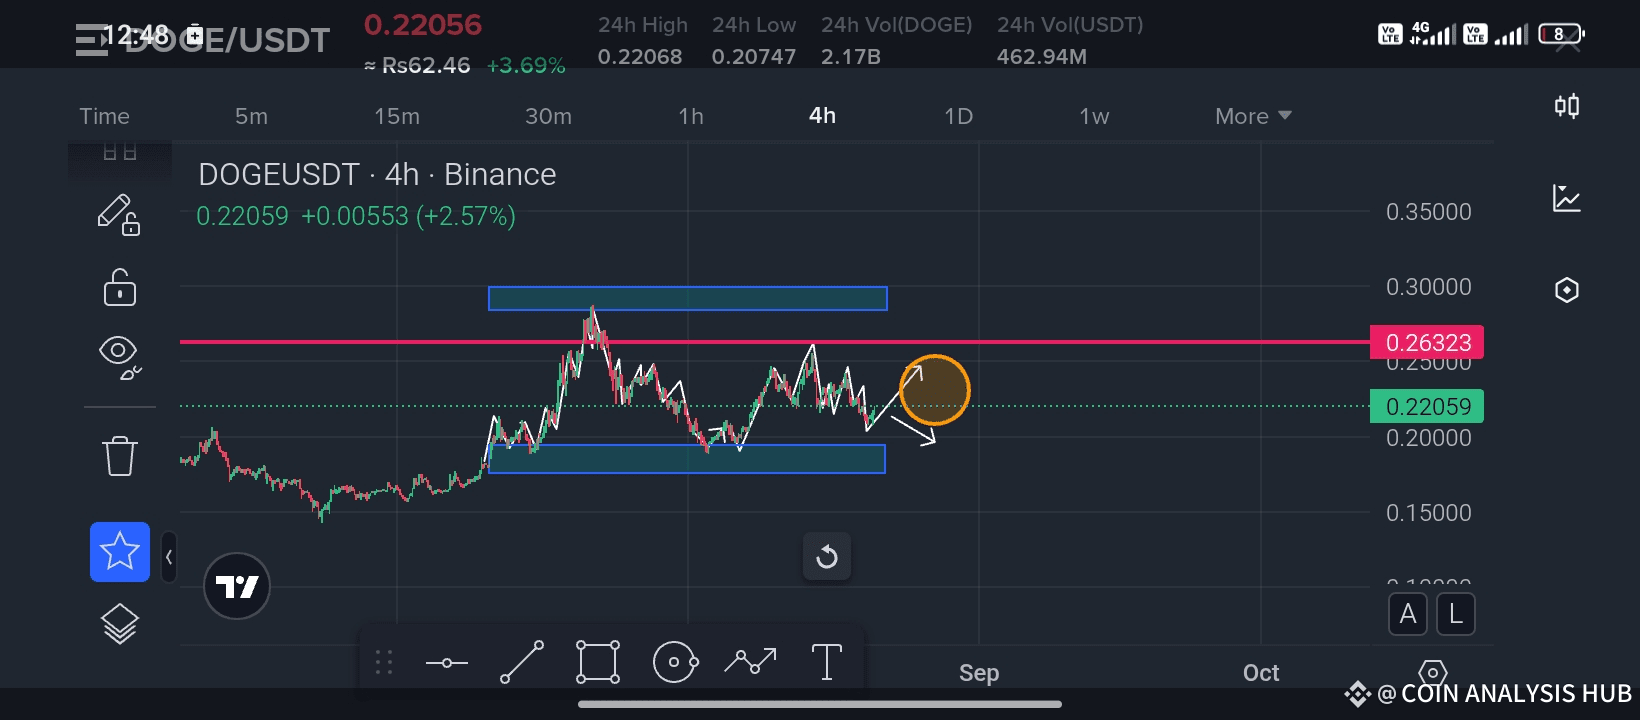
Current Price: 0.2205 (+2.57%)
On the 4H chart, we can clearly see price consolidating between strong support and resistance zones.
📊 Key Levels:
🔵 Support Zone: 0.205 – 0.210
🔵 Resistance Zone: 0.255 – 0.265
📍 Current Resistance to Watch: 0.2632
The market has respected these zones multiple times, forming a range-bound structure. The highlighted zone (orange circle) shows a potential short-term retracement followed by a bullish breakout attempt.
👉 If buyers gain momentum, we could see DOGE testing 0.2632 again. A breakout above this level with good volume may open the door towards 0.30.
👉 However, if rejection happens near resistance, expect another pullback into the support box.
💡 Trader’s Tip: Always wait for confirmation of breakout/rejection before entering. Risk management is the #1 priority in trading.
---
⚡ If you find this analysis helpful, don’t forget to like & share to motivate me to bring you more charts and insights every day. Let’s grow together! 💪🚀
Best of luck 🤞 🍀 🤞
