In the cryptocurrency market, Chainbase (C), as a token focused on distributed data networks, has experienced intense price volatility since its listing in July 2025. As an emerging asset, C's price trend reflects typical new coin characteristics: a rapid surge followed by a quick pullback, and then partial recovery. This article provides an in-depth analysis of C's overall trend based on the latest data from CoinMarketCap (as of August 19, 2025), including current market indicators, historical key points, and trend interpretations. Although it is not possible to directly capture the dynamic price chart from CoinMarketCap (the chart is loaded via JavaScript and has no fixed URL), we can recreate its trend characteristics through key data points and descriptions.
## Current Market Overview
C is currently performing relatively steadily but is still in an adjustment phase, displaying liquidity characteristics typical of small-cap coins. Below are the core indicators (all prices in USD):
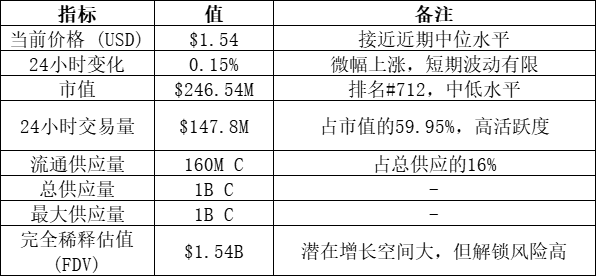
These data indicate that C has high trading activity (trading volume close to 60% of market cap), but low liquidity may lead to increased supply pressure in the future. The 24-hour price change is minimal, showing limited intraday fluctuations.
## Key Historical Price Points and Trend Description
C was listed around July 2025, initially benefiting from the hype around data infrastructure narratives, causing a rapid price increase. However, it later entered a volatile channel due to market corrections. Below are the historical extremes:
- Historical High Point (ATH): $3.91, on July 18, 2025 (about 1 month ago). This marks the peak during the initial listing phase, likely driven by project hype and investor enthusiasm.
- Historical Low Point (ATL): $0.535, on July 14, 2025 (about 1 month ago). The drop from ATH to ATL exceeded 86%, but the current price is up 188.03% from ATL, reflecting a rapid recovery.
The current price is down 60.6% from ATH, indicating a significant rebound from the peak but still not close to it.
Although it is not possible to directly capture the price chart image from CoinMarketCap (dynamically generated, no fixed URL), we can sketch its approximate trajectory based on available historical points:
- Initial Listing Phase (Mid-July): Price quickly surged from ATL $0.535 to ATH $3.91, forming a steep upward curve accompanied by high trading volume, possibly indicating strong buying interest and market FOMO.
- Pullback Phase (Late July): Sharp decline starting from July 18 ATH, losing over 60% of value in a short period. This period may present a clear downward channel with extremely high volatility, similar to a 'pump and dump' pattern.
- Recovery Phase (August to Present): A rebound of 188% from ATL, with prices consolidating around $1.50, forming a relatively flat bottom area. Recent slight increase over 24 hours suggests a potential short-term bottom, but lacks strong upward momentum.
- Overall Trend: Extremely volatile, experiencing dramatic swings within just one month of listing. There has been no long-term upward trend over the past month, more so a correction following the initial peak. Potential patterns include rapid pumps followed by pullbacks, common in newly listed tokens. If market sentiment improves, C may test the $2.00 resistance level; otherwise, it may continue to hover around the $1.00 support level.
To visualize, imagine a 'V' shaped curve that sharply rises from the July low to a peak, then steeply drops and slowly rises again, accompanied by high volatility. Detailed historical data can be referenced on CoinMarketCap's historical page, but this analysis relies on key anchor points.
## Influencing Factors and Future Outlook
C's movement is driven by multiple factors:
- Project Fundamentals: As a distributed data network, Chainbase could see price increases if new ecosystem integrations or partnerships (such as AI/big data applications) occur.
- Market Environment: As a small-cap coin (market cap <300M), C is highly dependent on the overall cryptocurrency market trends. The summer of 2025 sees significant market volatility, with macroeconomic or regulatory news potentially exacerbating this volatility.
- Risk Points: Low liquidity (only 16%) means that future token unlocks could trigger selling pressure. High volatility (over 60% drop from ATH to current) is suitable for short-term traders, but caution is needed for long-term holders.
Overall, C is currently in a strong rebound phase from its lows, but still has a distance to recover to ATH. Investors should monitor changes in trading volume and market signals. It is recommended to combine technical analysis tools (such as moving averages) for further validation of trends.
