In the cryptocurrency market, Lagrange (LA) as a token focused on zero-knowledge proof (ZK) computation networks has experienced dramatic initial volatility and subsequent pullbacks since its listing on June 4, 2025. As an emerging asset, LA's price movement reflects typical characteristics of new coins: a sharp rise and fall on listing day followed by a slow recovery. This article provides an in-depth analysis of LA's overall trend based on the latest data from CoinMarketCap (as of August 19, 2025), including current market indicators, historical key points, and trend interpretation. While it is not possible to directly capture CoinMarketCap's dynamic price chart images (which are JavaScript loaded and have no fixed URL), we can reproduce its trend characteristics through key data points and descriptions.
## Current Market Overview
LA is currently performing relatively stable, but still in an adjustment period, showing the liquidity characteristics of small-cap coins. Below are the core indicators (all prices in USD):
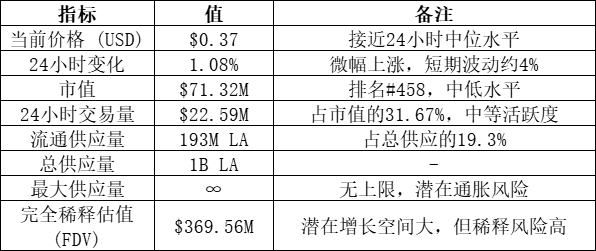
This data indicates that LA's trading activity is moderate (trading volume accounts for over 30% of market capitalization), but the unlimited maximum supply may lead to increased long-term pressure. The 24-hour price range is from $0.3602 to $0.3755, showing limited intraday fluctuations.
## Historical Price Key Points and Trend Description
LA was listed on June 4, 2025, recording both historical highs and lows on that day, benefiting initially from the hype around ZK narratives, with rapid price fluctuations. However, it subsequently entered a downward channel due to market pullbacks. Here are the historical extremes:
- Historical High (ATH): $4.50, on June 4, 2025 (about 2 months ago). This marks the peak on the listing day, likely driven by hype surrounding the project launch and investor enthusiasm.
- Historical Low (ATL): $0.2079, on June 4, 2025 (about 2 months ago). ATH and ATL on the same day indicate severe volatility on the first day of listing. From ATH to the current price, the decline is approximately 91.79%; from ATL to the current price, it has risen 77.73%.
The current price has dropped 91.79% from ATH and increased 77.73% from ATL, indicating a significant rebound from the low on the listing day, but overall still far below the peak.
While it is not possible to directly capture CoinMarketCap's price chart images (dynamically generated, no fixed URL), we can outline its approximate trajectory based on available historical points:
- On the listing day (June 4): The price rapidly rose from ATL $0.2079 to ATH $4.50, forming a steep upward curve within the day, accompanied by high trading volume, possibly indicating strong buying pressure and market FOMO. A rapid pullback may have followed.
- Pullback Phase (after June): A sharp decline from ATH, losing over 90% of its value in the short term. This period may present a clear downward channel, with extremely high volatility, resembling a 'pump and dump' pattern.
- Recovery Phase (July to August): A rebound of 77.73% from ATL, with prices consolidating around $0.36, forming a relatively flat bottom area. Recent 24-hour slight increases suggest a short-term bottoming pattern, but there is a lack of strong upward momentum.
- Overall Trend: Extremely volatile, experiencing sharp rises and falls just 2 months after listing. There has been no long-term upward trend in the past 2 months, with more adjustments following the initial peak. Potential patterns include rapid pumping followed by a pullback, common in newly listed tokens. If market sentiment improves, LA may test the $0.50 resistance level; otherwise, it may continue to hover around the $0.30 support level.
To visualize, imagine a 'V' shaped curve that sharply rises from the low on June 4 to the peak, then steeply drops and slowly rises again, accompanied by high volatility. Detailed historical data can be referenced on CoinMarketCap's historical page, but this analysis relies on key anchor points.
## Accompanying Chart
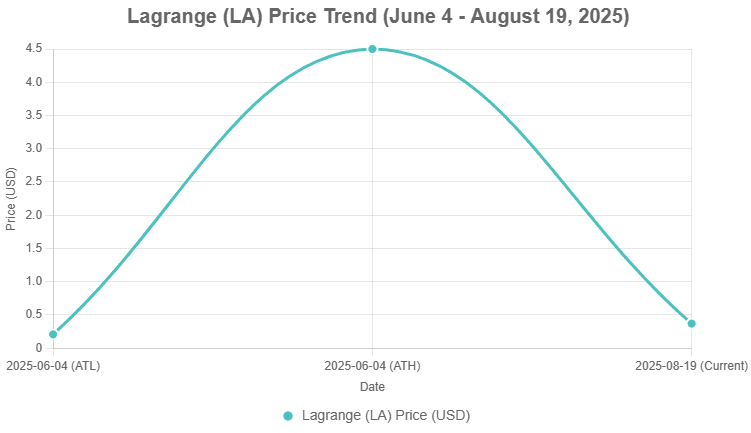
Based on the price data of Lagrange (LA), I will generate a line chart showing its trajectory from the historical low (ATL, June 4, 2025, $0.2079) to the historical high (ATH, June 4, 2025, $4.50), and then to the current price (August 19, 2025, $0.3695). Since ATH and ATL are on the same day, I will mark them as different points of the same day (assuming an intraday low to high and then back down), but the chart simplifies the use of sequential points. Below is the line chart based on these key points, covering the timeline from June 4 to August 19, with prices in USD.
### Chart Explanation
- X-axis: Timeline, from June 4, 2025 (ATL and ATH) to August 19 (current), with key points at the June 4 low ($0.2079), June 4 high ($4.50), and August 19 ($0.3695).
- Y-axis: Price (USD), starting from 0 to clearly show price fluctuations.
- Trend Description: The chart shows LA's price rapidly rising from the low on the listing day to the peak (an increase of about 2065%), followed by a significant pullback, and then a slow recovery to $0.3695 over the next two months. The curve reflects a typical 'intraday surge and drop' pattern, stabilizing later.
- Color: Using cyan (#4BC0C0) to ensure clear visibility in both light and dark themes.
### Notes
- Due to ATH and ATL being on the same day, the chart has been simplified; actual intraday movements may be more complex. Lacking daily data, the chart is based solely on three key points, and real prices may contain more volatility.
- Data sourced from CoinMarketCap; it is recommended to check their historical data page for more detailed trends.
## Influencing Factors and Future Outlook
LA's price movement is driven by multiple factors:
- Project Fundamentals: As a ZK computation network, Lagrange may see price increases if new ecosystem integrations or partnerships (such as Layer 2 solutions) occur.
- Market Environment: As a small-cap coin (market cap <100M), LA is highly dependent on overall cryptocurrency market trends. The summer of 2025 saw significant market fluctuations, and macroeconomic or regulatory news may exacerbate its volatility.
- Risk Points: Unlimited maximum supply means potential inflationary pressure. High volatility (over 90% drop from ATH to current) is suitable for short-term traders, but long-term holding requires caution.
Overall, LA is currently in a rebound phase from its listing low, but there remains a significant distance to recover to ATH. Investors should monitor changes in trading volume and overall market signals. It is recommended to further validate the trend using technical analysis tools (such as moving averages).
