In the cryptocurrency market, Huma Finance (HUMA), as a DeFi protocol token focused on financing Real World Assets (RWA), has experienced significant volatility since its listing in May 2025. As a relatively young asset, HUMA's price trend reflects the typical cycle of market hype, corrections, and slow recovery. This article provides an in-depth analysis of HUMA's overall trend based on the latest data from CoinMarketCap (as of August 19, 2025), including current market indicators, historical key points, and trend interpretations. Although it is not possible to directly capture dynamic price charts from the website (due to the charts being JavaScript loaded and unable to be captured statically), we can reproduce its trend characteristics through key data points and descriptions.
## Current Market Overview
HUMA is currently performing steadily but remains at a low level, displaying typical characteristics of small-cap coins: medium liquidity, easily influenced by the broader market. Here are the core indicators:
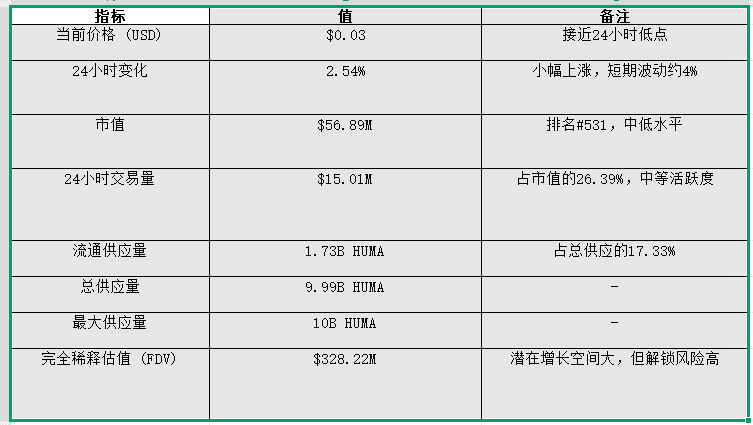
These data indicate that HUMA's short-term liquidity is acceptable, but low circulation rates may lead to increased supply pressure in the future. The 24-hour price range is from $0.03277 to $0.03422, showing limited intraday fluctuations.
## Key Historical Price Points and Trend Descriptions
HUMA was listed around May 2025, benefiting initially from the hype around DeFi and RWA narratives, with prices rising rapidly. However, it then entered a downward channel influenced by overall market corrections (such as Bitcoin price fluctuations). Here are the historical extremes:
- All-Time High (ATH): $0.06927 on May 27, 2025 (about 3 months ago). This marks the peak in the early listing stage, likely stemming from project launch hype and investor FOMO (fear of missing out).
- All-Time Low (ATL): $0.02946 on June 26, 2025 (about 2 months ago). The drop from ATH to ATL exceeds 57%, reflecting rapid profit-taking and low market confidence.
The current price is down 52.62% from ATH and up 11.4% from ATL, indicating a slight rebound since the end of June, but the force is insufficient to reverse the overall downward trend.
Although it is not possible to directly capture the price trend chart image from CoinMarketCap (the chart is dynamically generated and has no fixed URL), we can sketch its approximate trajectory based on available historical points:
- Early Listing (May): The price quickly surged from a low to ATH $0.06927, forming a steep upward curve accompanied by high trading volume, which may indicate strong buying interest.
- Correction Phase (June): After a sharp decline starting from the end of May, it bottomed out at $0.02946 on June 26. This period may show a clear downward channel with high volatility, similar to the left side of a 'V' shape reversal.
- Recovery Phase (July to August): Rebounding about 11% from ATL, the price consolidates around $0.03, forming a relatively flat bottom area. Recent slight increases in the 24-hour timeframe suggest short-term bottoming, but lack breakthrough momentum.
- Overall Trend: High open and low close, entering a bear market adjustment since ATH. There has been no significant upward trend in the past three months, more of a weak rebound after a downward fluctuation. Potential patterns include initial pumping followed by dumping, commonly seen in newly listed small-cap coins. If the broader market warms up, HUMA may test the $0.04 resistance level; otherwise, it may continue to hover around the $0.03 support level.
To visualize, one could imagine a curve that sharply drops from the May peak to the June low and then slowly climbs. Detailed historical data can be referenced on CoinMarketCap's historical page, but due to dynamic loading, this analysis relies on key anchor points.
## Influencing Factors and Future Outlook
HUMA's trend is driven by multiple factors:
- Project Fundamentals: Huma Finance focuses on on-chain lending and RWA tokenization. Any new partnerships or product updates (such as integrating more chains) may stimulate price increases.
- Market Environment: As a small-cap coin (market cap <100M), HUMA is highly dependent on the movements of Bitcoin/Ethereum. The cryptocurrency market is highly volatile in the first half of 2025, and Federal Reserve policies or regulatory news may exacerbate this volatility.
- Risk Points: Low circulation rate (only 17%) means that future token unlocks may trigger selling pressure. High volatility (over 50% drop from ATH to ATL) is suitable for short-term traders, but long-term holding should be approached with caution.
Overall, HUMA is currently in the early stages of a rebound, but still has a distance to recover to ATH. Investors should monitor changes in trading volume and broader market signals. It is recommended to further verify trends using technical analysis tools (such as moving averages).
