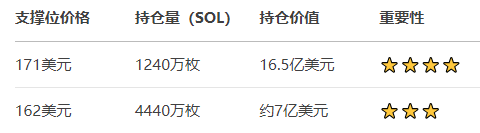
Holding Concentration: There is a large-scale accumulation of holdings around $171, with on-chain data showing that 12.4 million SOL, worth about $1.65 billion, are stored at this position, forming strong support. If the price pulls back to this area, it may trigger defensive buying from bulls, suppressing further declines.
Technical Validation: SOL has tested the resistance level of $171 multiple times, and after successfully breaking through recently, it has turned into support, consistent with the technical logic of resistance turning into support.
Risk Warning: If the price effectively drops below $171, it may trigger stop-loss selling pressure, with the next support looking at $162, near the 50-day moving average.
Current Price and Market Performance: As of August 18, the real-time price of SOL is $187.19, approximately 1,349.96 CNY, with a 24-hour decline of 0.63%, and a trading volume of $4.94 billion, an increase of 23.54%.
Short-term Volatility: The intraday trading range is $187.09-195.89, failing to hold above the $190 mark indicates short-term pressure.
Technical Indicators and Bull-Bear Signals, Golden Cross Pattern: The daily MA50 has crossed above MA200, forming a golden cross, which typically indicates a continuation of the medium to long-term bullish trend.
RSI and Overbought Risk: The Relative Strength Index (RSI) is at 68.50, close to the overbought threshold of 70, caution is needed for potential short-term pullback pressure.
Derivatives Market, Open Interest: Increased to $2.31 billion, a monthly peak, indicating continuous capital inflow.
Financing Rate: Positive at 0.0137, indicating a bullish dominance, but high leverage may exacerbate volatility.
Market Participant Behavior Analysis, Whale Accumulation: In August, a giant whale purchased 71,000 SOL from Binance, worth $12 million, and staked it in the Kamino protocol, indicating a long-term bullish outlook.
Retail Following: There is a net outflow of $6.86 million in spot trading, with a decrease in sell orders on exchanges, reflecting a reluctance to sell among retail investors.
Institutional Movements: The inflow of funds into the Solana ETF has reached $137.4 million since July, supporting price resilience.
Upward Potential and Key Resistance, Breakthrough Path: If it stabilizes above the 20-day moving average at $172, the next target would be $186.32, with a breakthrough likely challenging the psychological level of $200.
Strong Resistance Zone: $205-209 is the technical ceiling since March, requiring a significant volume breakout to confirm a new uptrend.
Short-term Trend Prediction, Optimistic Scenario: Holding the support at $171, combined with golden cross momentum and institutional capital inflow, may test the $200-214 range before September.
Cautious Scenario: RSI is overbought, combined with high leverage in derivatives; if Bitcoin's volatility increases, SOL may retest the support zone of $162-165.
Currently, SOL is in a bullish-dominated but technically overbought phase. The support level at $171 is a watershed for the short-term market; if it stabilizes, an upward trend is expected to continue, but if it breaks down, a deep pullback should be anticipated. It's advised to pay attention to on-chain whale movements and the correlation with Bitcoin's market; short-term traders can look to buy on dips, while long-term investors should hold until prices rise.
