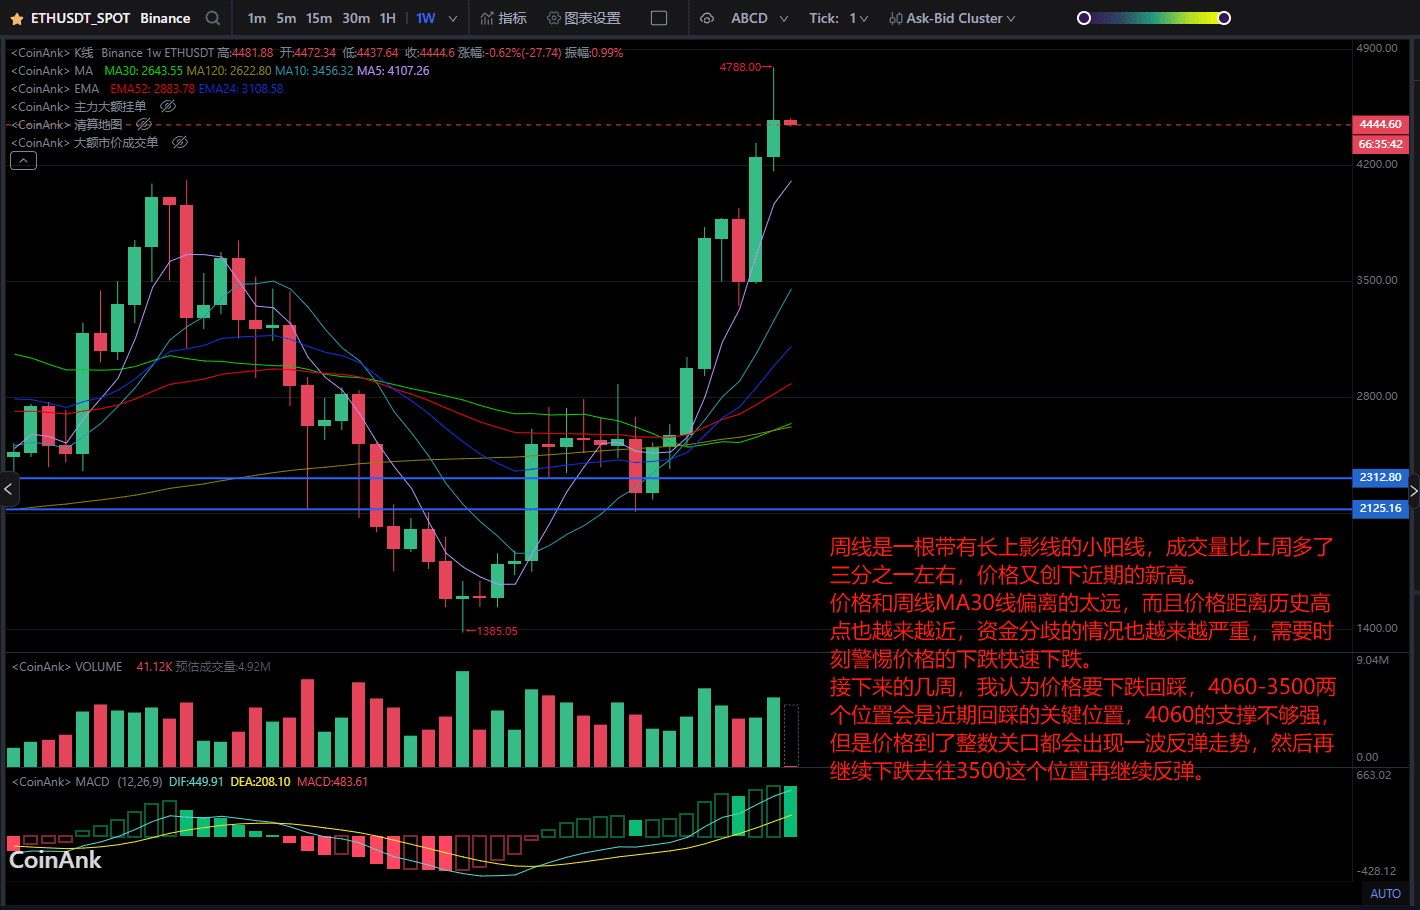
The weekly chart shows a small bullish candle with a long upper shadow, and the trading volume increased by about one-third compared to last week, with the price reaching a recent new high.
The price is too far from the weekly MA30 line, and it is getting closer to the historical high, with increasing divergence in funds, making it necessary to remain vigilant against a rapid price decline.
In the coming weeks, I believe the price will drop back to test. The two key positions for recent testing will be 4060-3500. The support at 4060 is not strong enough, but when the price reaches round numbers, there will be a rebound trend, and then continue down to the 3500 position before rebounding again.
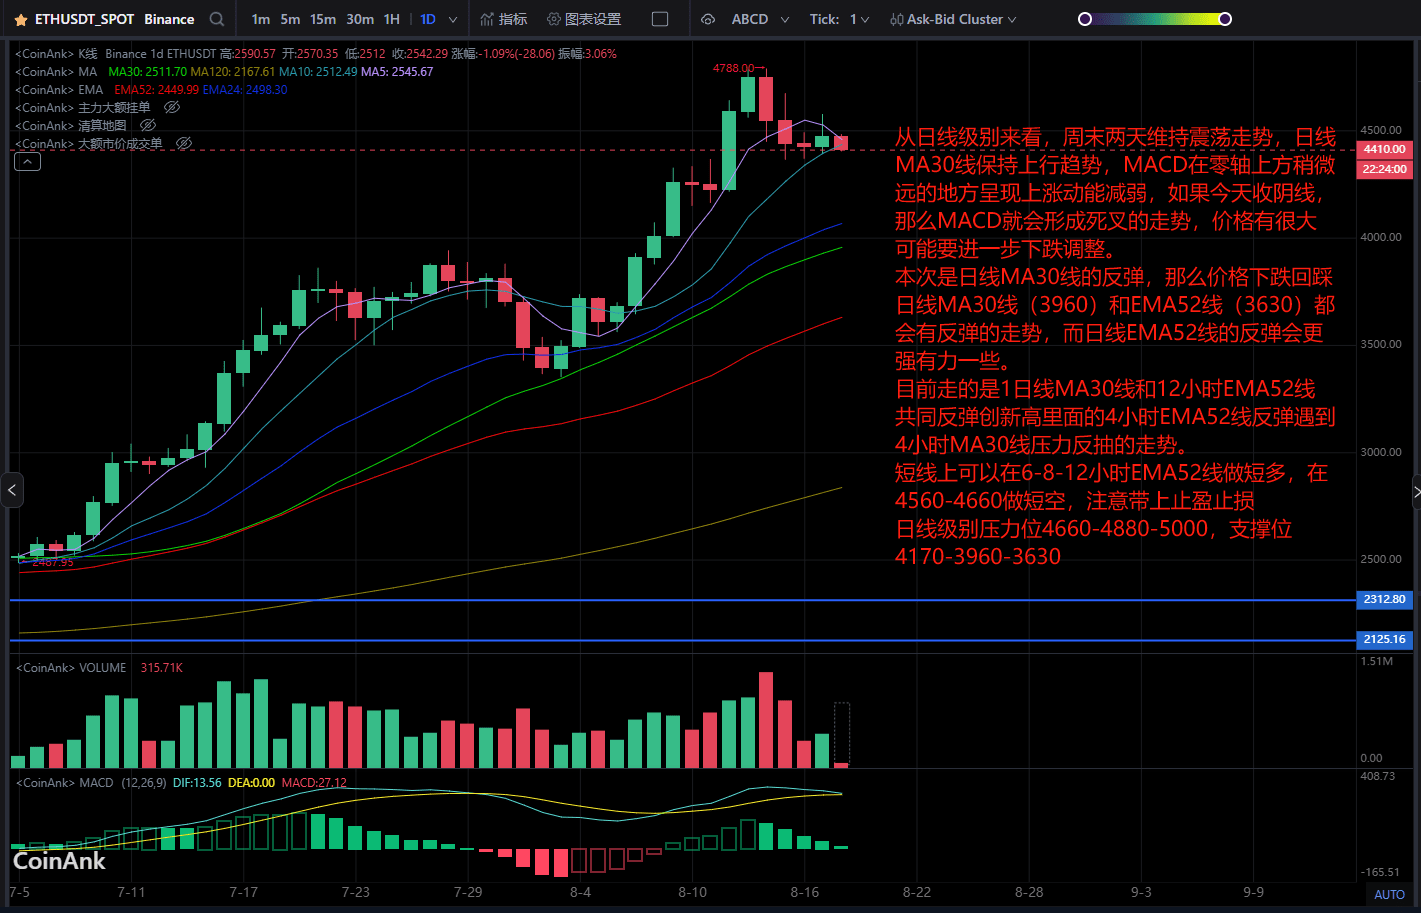
From the daily level, the market maintained a volatile trend over the weekend, with the daily MA30 line keeping an upward trend. The MACD shows weakening upward momentum slightly above the zero axis; if today closes with a bearish candle, the MACD will form a death cross, and the price is likely to further decline and adjust.
This is a rebound from the daily MA30 line, so if the price drops back to the daily MA30 line (3960) and EMA52 line (3630), there will be a rebound trend, with the rebound from the daily EMA52 line being stronger.
Currently, the price is in a rebound above the daily MA30 line and the 12-hour EMA52 line, with the 4-hour EMA52 line encountering resistance from the 4-hour MA30 line during the rebound.
On the short line, a short long can be made at the 6-8-12 hour EMA52 line, and a short can be made at 4560-4660, remember to set take profit and stop loss.
The daily level resistance is at 4660-4880-5000, and support is at 4170-3960-3630.