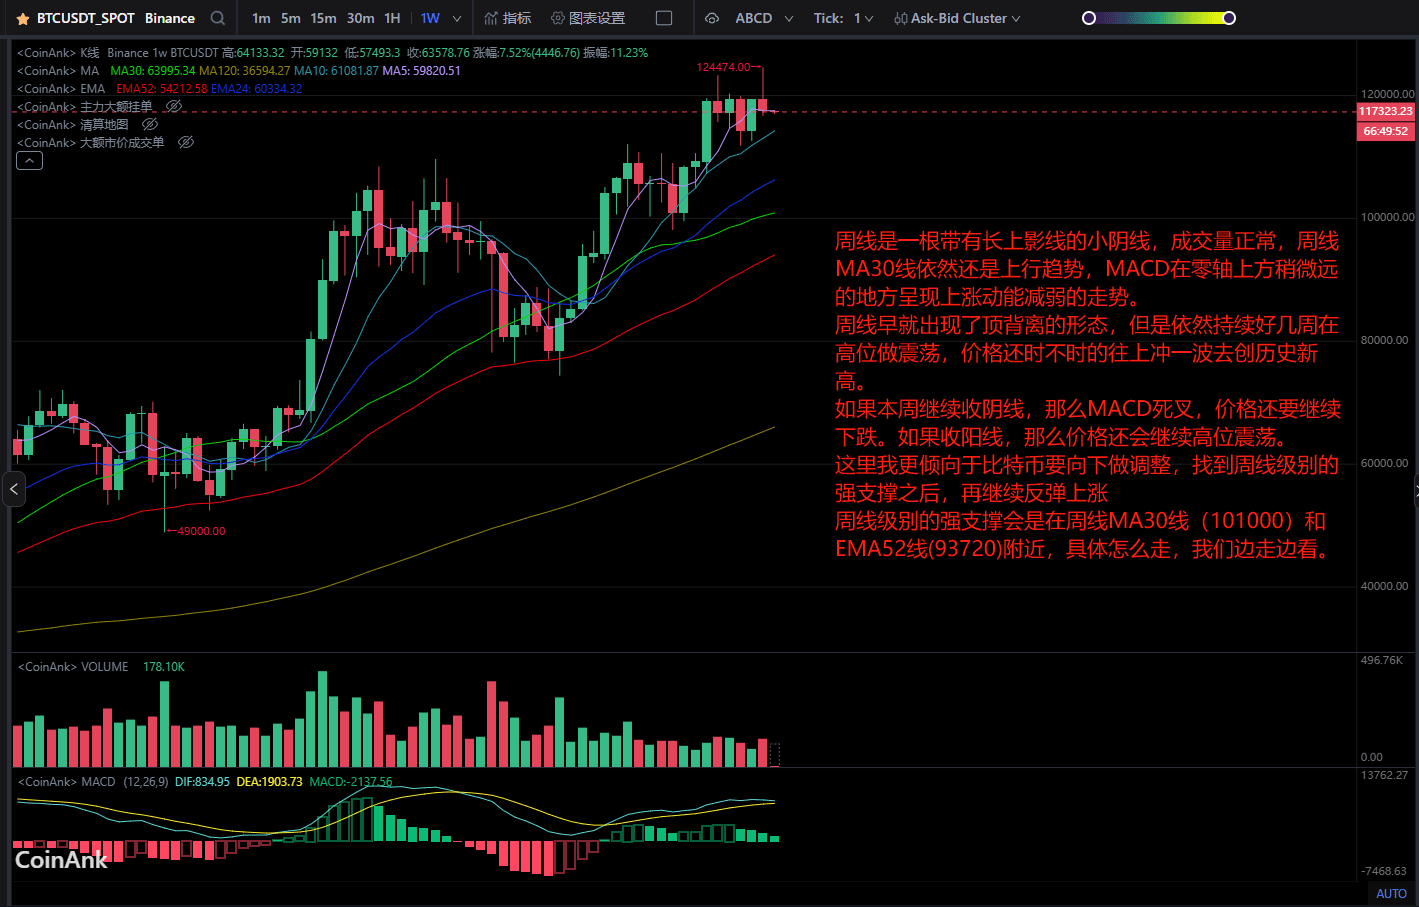
The weekly candle is a small bearish candle with a long upper shadow, with normal trading volume. The weekly MA30 line is still in an upward trend, and the MACD shows weakening upward momentum slightly above the zero line.
The weekly chart has long shown a top divergence pattern, but it continues to oscillate at high levels for several weeks, with the price occasionally spiking upwards to create new historical highs.
If this week continues to close with a bearish candle, then the MACD will form a death cross, and the price will continue to drop. If it closes with a bullish candle, the price will continue to oscillate at a high level.
Here, I lean towards Bitcoin making a downward adjustment, finding strong support at the weekly level, and then continuing to rebound upward.
The strong support at the weekly level will be near the weekly MA30 line (101000) and EMA52 line (93720). How it moves specifically, we will see as we go along.
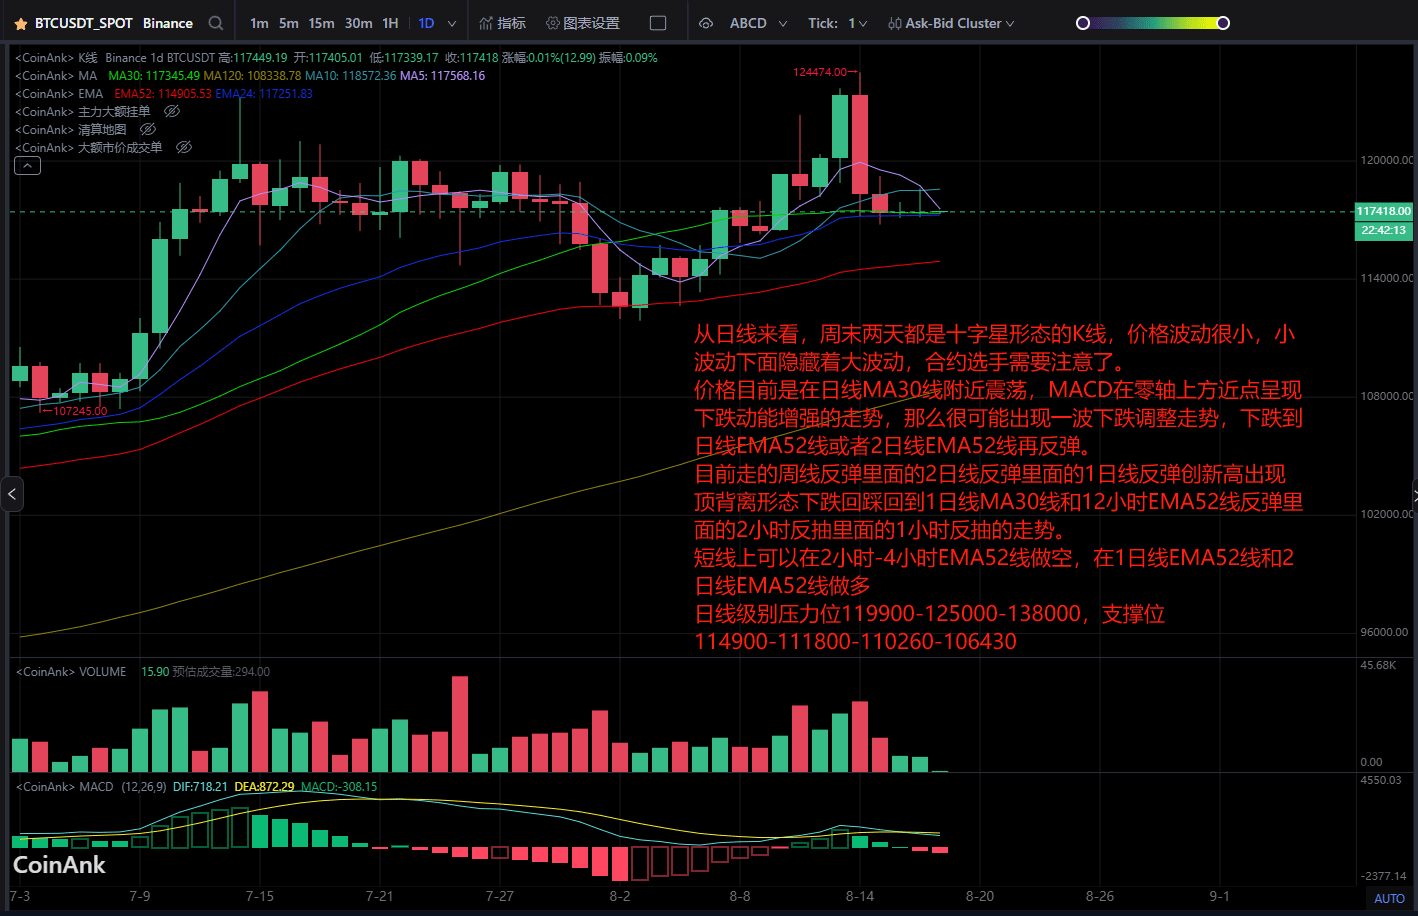
Currently, the weekly rebound includes a 2-day rebound within a 1-day rebound, which has reached a new high and formed a top divergence pattern, leading to a drop back to the 1-day MA30 line and the 12-hour EMA52 line, with a 2-hour pullback within a 1-hour pullback.
In the short term, one can short at the 2-hour-4-hour EMA52 line, and go long at the 1-day EMA52 line and 2-day EMA52 line.
Daily level resistance is at 119900-125000-138000, and support is at 114900-111800-110260-106430.