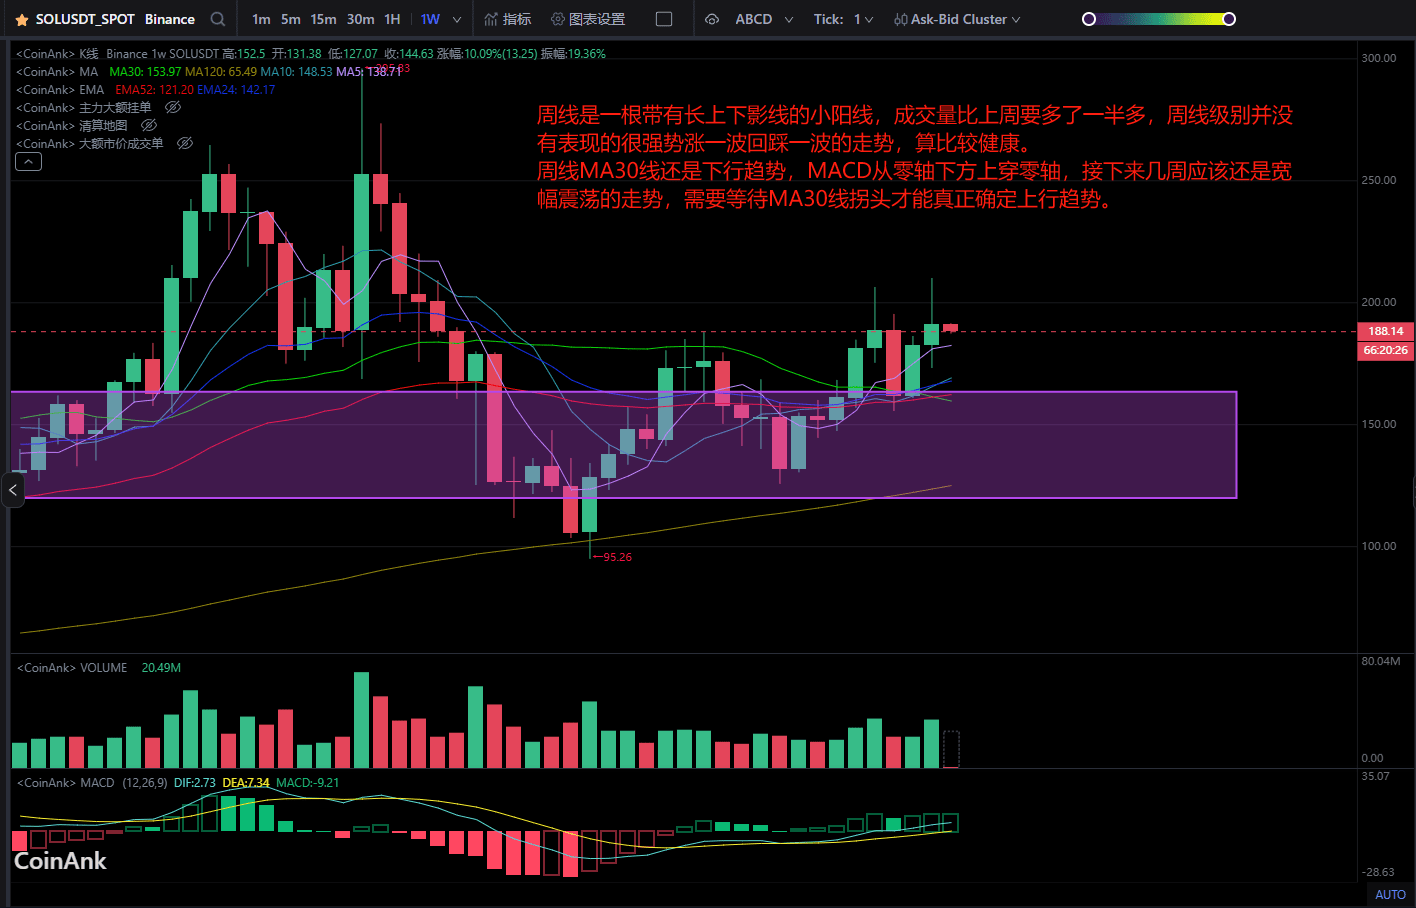
The weekly chart shows a small bullish candle with long upper and lower shadows, and the trading volume has increased by more than half compared to last week. The weekly trend does not show a very strong upward move followed by a pullback, which is considered relatively healthy.
The weekly MA30 line is still in a downward trend. The MACD has crossed above the zero line from below, so the next few weeks should still see a wide-ranging oscillation. We need to wait for the MA30 line to turn before we can truly confirm an upward trend.
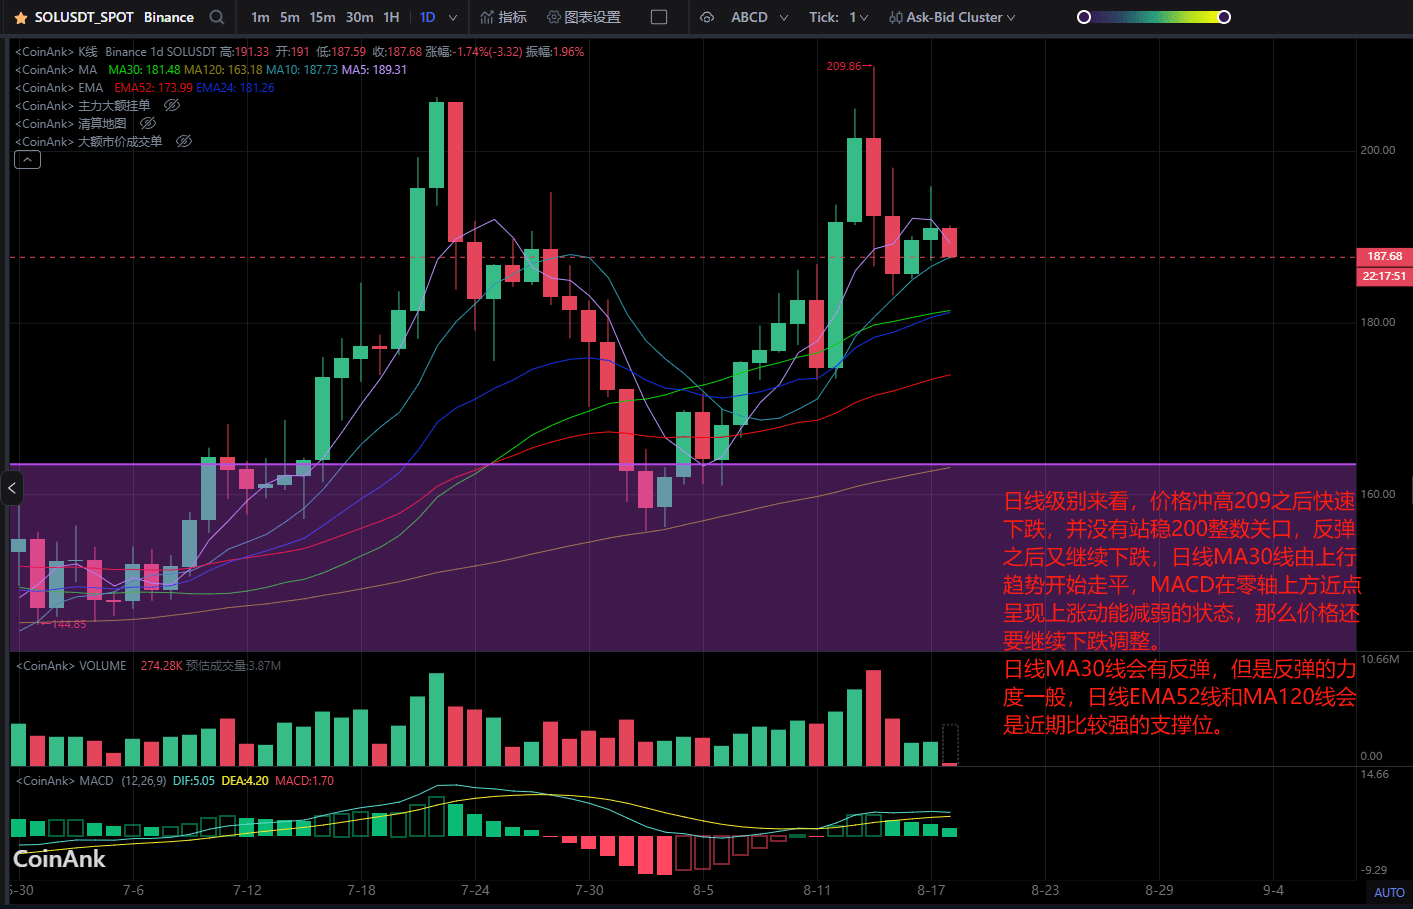
From a daily perspective, the price quickly fell after peaking at 209 and did not stabilize above the 200 round number. After a rebound, it continued to decline. The daily MA30 line has begun to flatten after an upward trend, and the MACD is showing a weakening upward momentum above the zero line, indicating that the price still needs to continue to decline and adjust.
The daily MA30 line may have a rebound, but the strength of the rebound is generally weak. The daily EMA52 line and MA120 line will be relatively strong support levels in the near term.
Daily resistance levels are 199-213-237-250, and support levels are 174-164-156-145-136.