1. Technical Analysis
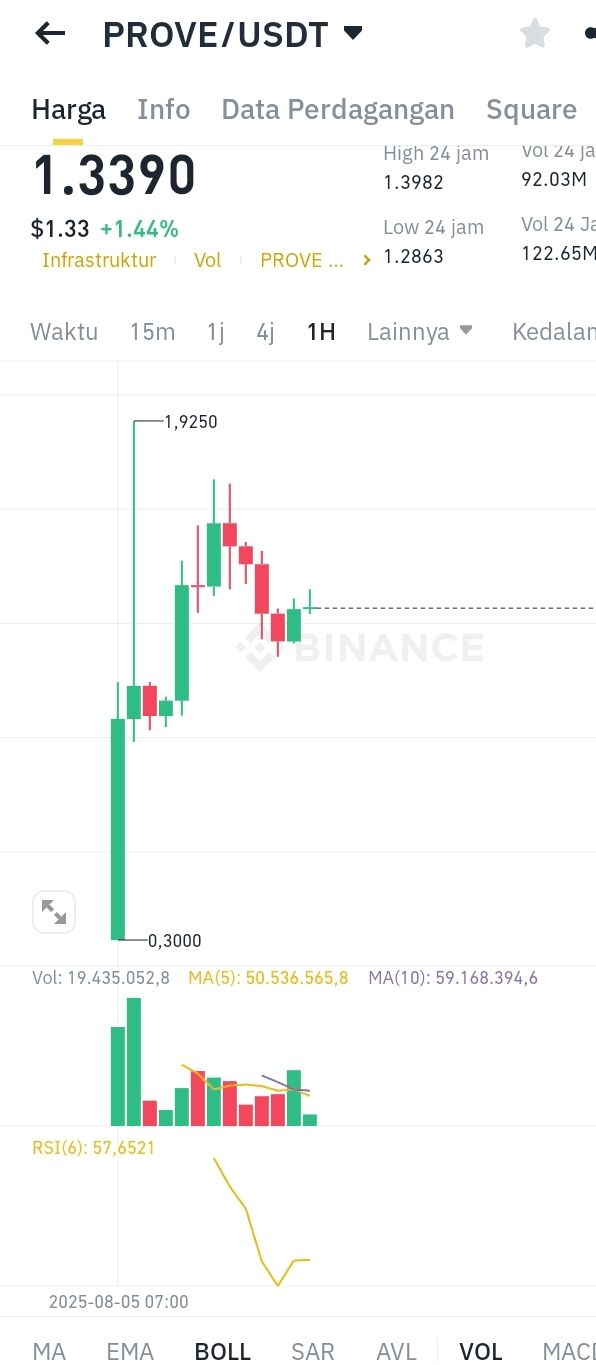
Current Price: $1.3390 (+1.44%)
The price is between the 24-hour high ($1.3982) and the 24-hour low ($1.2863).
Nearest resistance: $1.3982 (High 24 hours).
Nearest support: $1.2863 (Low 24 hours).
Technical Indicators:
RSI (6): 57.65 (Neutral, tending towards overbought).
If RSI > 70: Potential overbought (sell signal).
If RSI < 30: Potential oversold (buy signal).
Trading Volume:
24-hour volume (PROVE): 92.03M (high, indicating good liquidity).
24-hour volume (USDT): 122.65M (positively correlated with price movement).
Moving Averages (MA/EMA):
If the price is above MA/EMA: Uptrend (bullish).
If the price is below MA/EMA: Downtrend (bearish).
MACD: Not yet visible on data, but if the MACD line crosses above the signal: bullish.
Psychological Level:
$1.3000 (strong support).
$1.4000 (psychological resistance).
2. Market Sentiment Analysis
Volatility: High (daily range $1.2863-$1.3982).
Liquidity: Good (high volume on both PROVE and USDT sides).
Market Context:
Pay attention to overall crypto market sentiment (e.g., Bitcoin trend, macroeconomic news).
3. Trading Strategies
A. Scalping (Timeframe 15m-1H)
Entry:
Buy around $1.2863 (support) with confirmation of rebound (RSI > 30 and buying volume increasing).
Sell around $1.3982 (resistance) if the price is rejected (RSI > 70).
Stop Loss: 2-3% below entry (e.g., $1.25).
Profit Target: 3-5% (e.g., $1.35-$1.38).
B. Swing Trading (Timeframe 4H-1D)
Entry:
Buy if the price breaks $1.3982 with high volume (breakout).
Sell if the price drops below $1.2863 with high volume (breakdown).
Stop Loss: 5% below entry.
Profit Target: 10-15% (e.g., $1.50-$1.60).
C. Grid Trading Strategy
Range: $1.28-$1.40.
Buy: At levels $1.30, $1.28.
Sell: At levels $1.35, $1.38, $1.40.
Note: Suitable for sideways markets.
4. Risk Management
Use automatic stop loss to avoid large losses.
Allocate a maximum of 2-5% of capital per trade.
Avoid FOMO (Fear of Missing Out) when the price is volatile.
5. Additional Recommendations
Monitor News: Pay attention to developments in the PROVE project (e.g., partnerships, technology updates).
Use Additional Indicators:
Bollinger Bands for volatility identification.
Order Book Volume (Market Depth) to see liquidity.
Conclusion
Bullish: If the price holds above $1.33 with high volume, target $1.40-$1.50.
Bearish: If the price fails to break $1.2863, potential drop to $1.20.
Neutral/Sideways: If the price consolidates at $1.28-$1.40, use a grid strategy.
Disclaimer: Crypto trading is highly risky. This analysis is not financial advice. Do your own research.