Based on the latest technical data for **DOGE/USDT** (up to August 16, 2025 - 21:18), here is the comprehensive analysis:
---
### 📊 Price Expectations and Pivot Levels
| **Level** | **Value (Classic)** | **Expectations** |
|---------------|----------------------|---------------------|
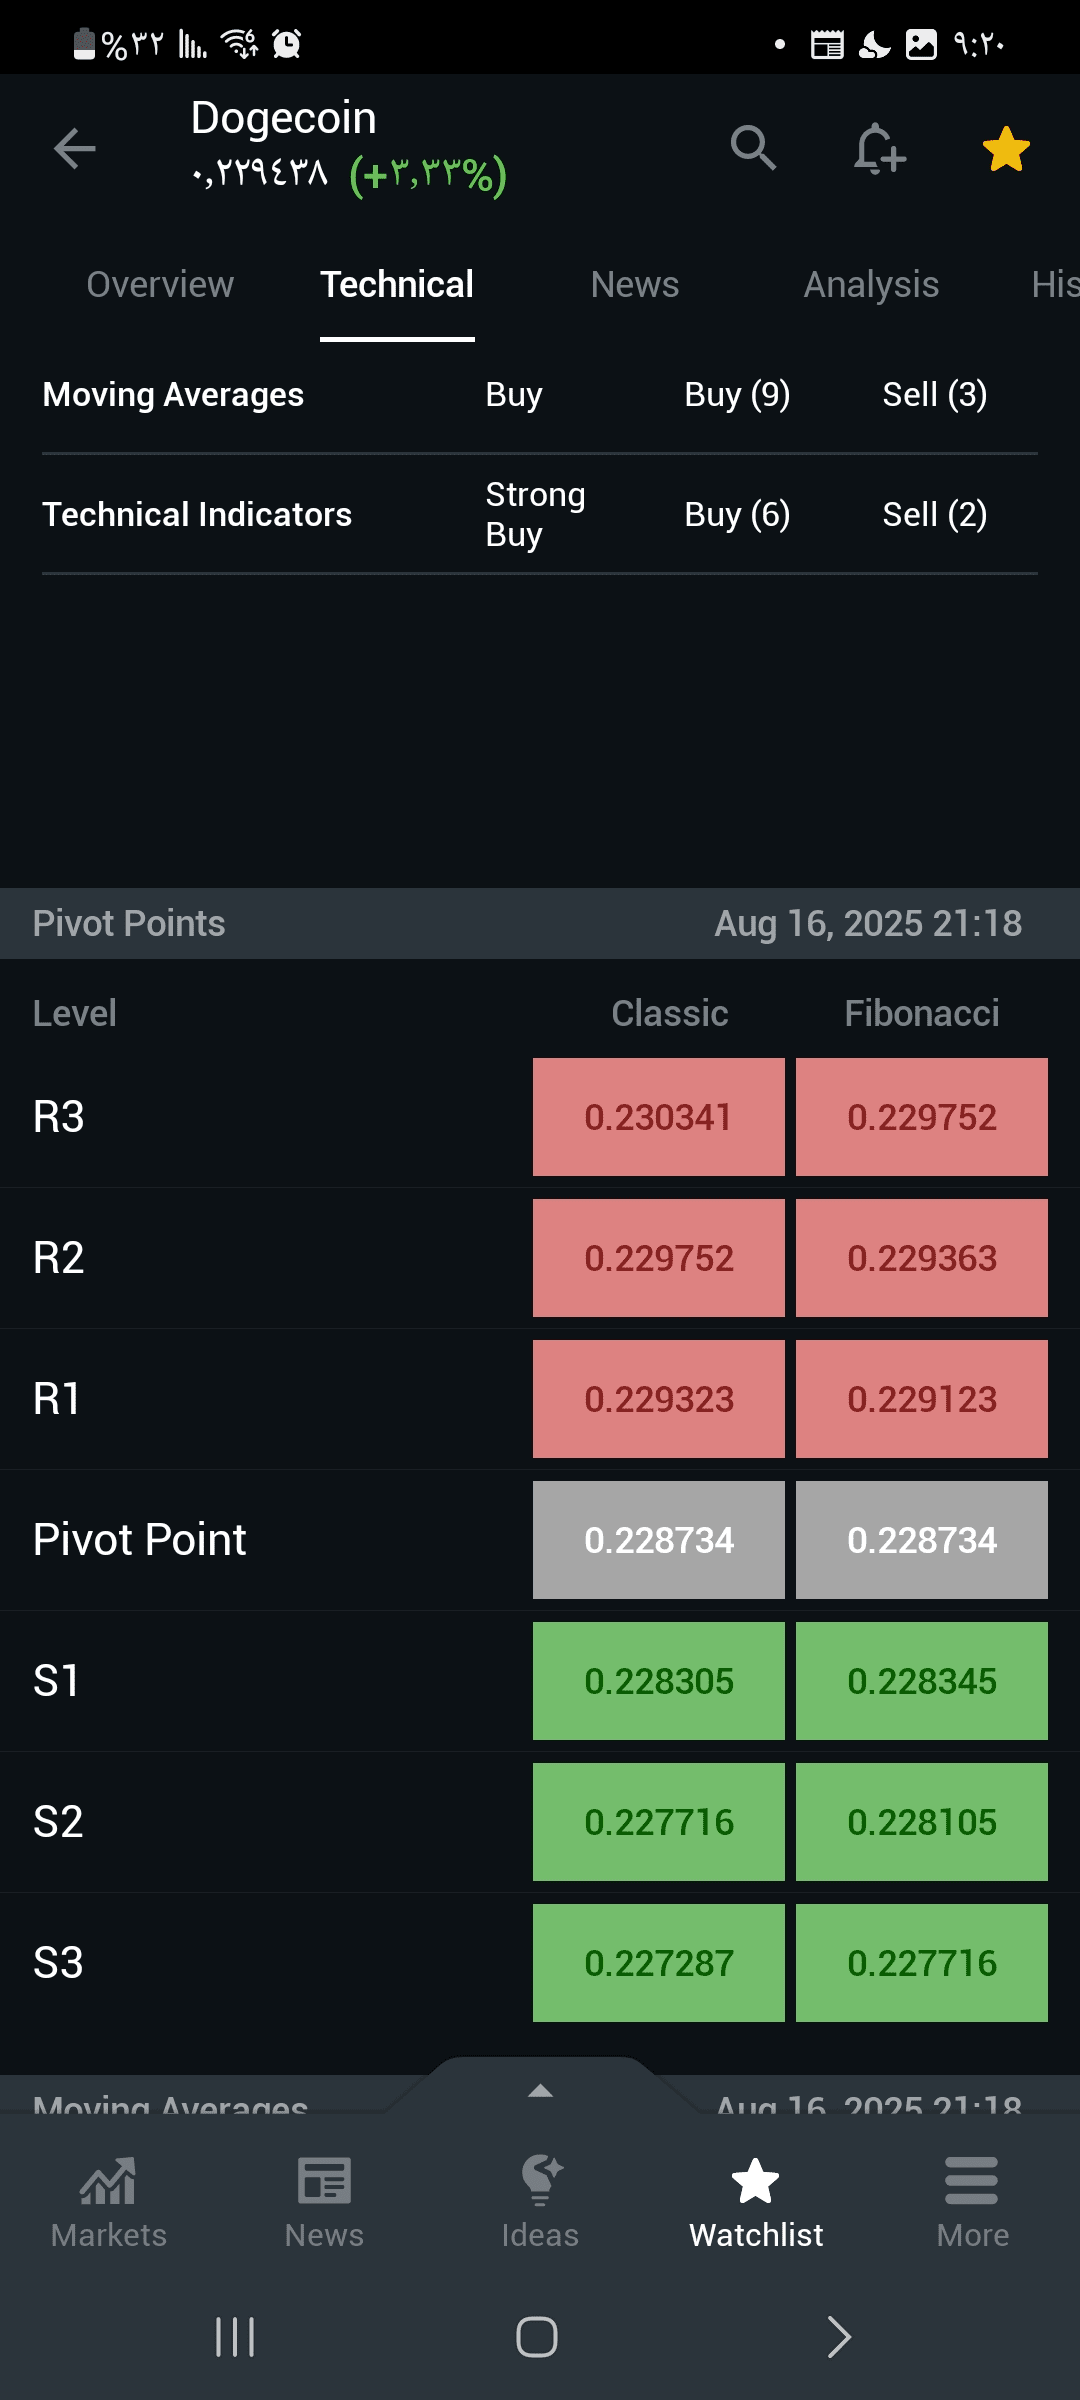
| **Resistance R3** | 0.230341 | Breaking it opens the way for 0.232+ |
| **Resistance R2** | 0.229752 | Potential test with selling pressure |
| **Resistance R1** | 0.229323 | Major immediate resistance |
| **Pivot Point** | 0.228734 | Balance point |
| **Support S1** | 0.228305 | Potential buying area |
| **Support S2** | 0.227716 | Breaking it strengthens the decline |
- **Current price**: Assumed to be close to **0.2290-0.2300** (based on indicators).
---
### 📈 Momentum Analysis: **Bullish but overbought**
1. **Positive signals**:
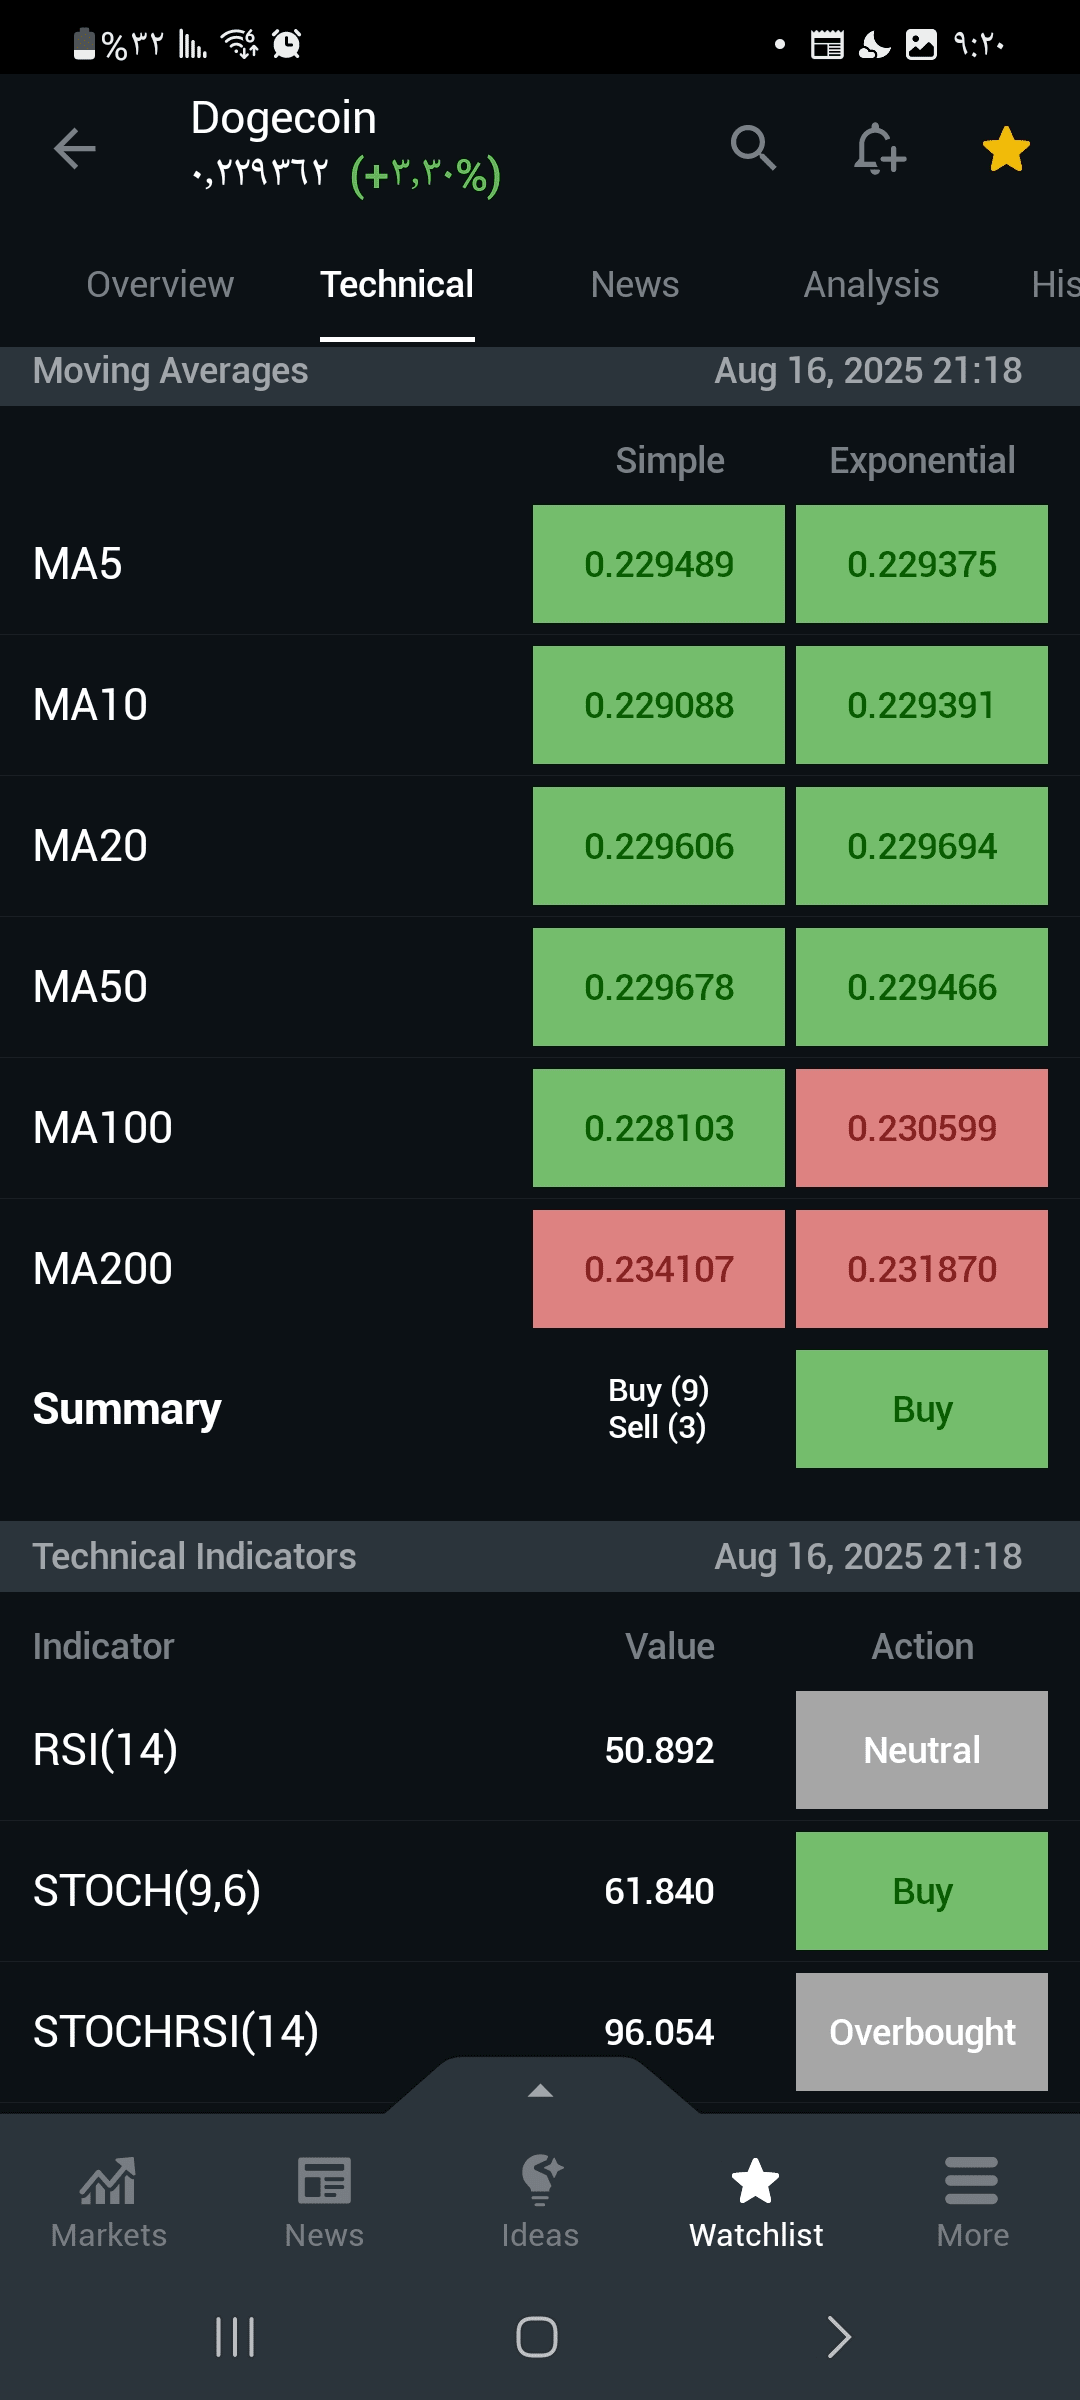
- **Moving Averages**: **9 buy signals** vs 3 sell → Strong bullish trend.
- **Momentum indicators**:
- STOCH(9,6): **61.84** (buy signal).
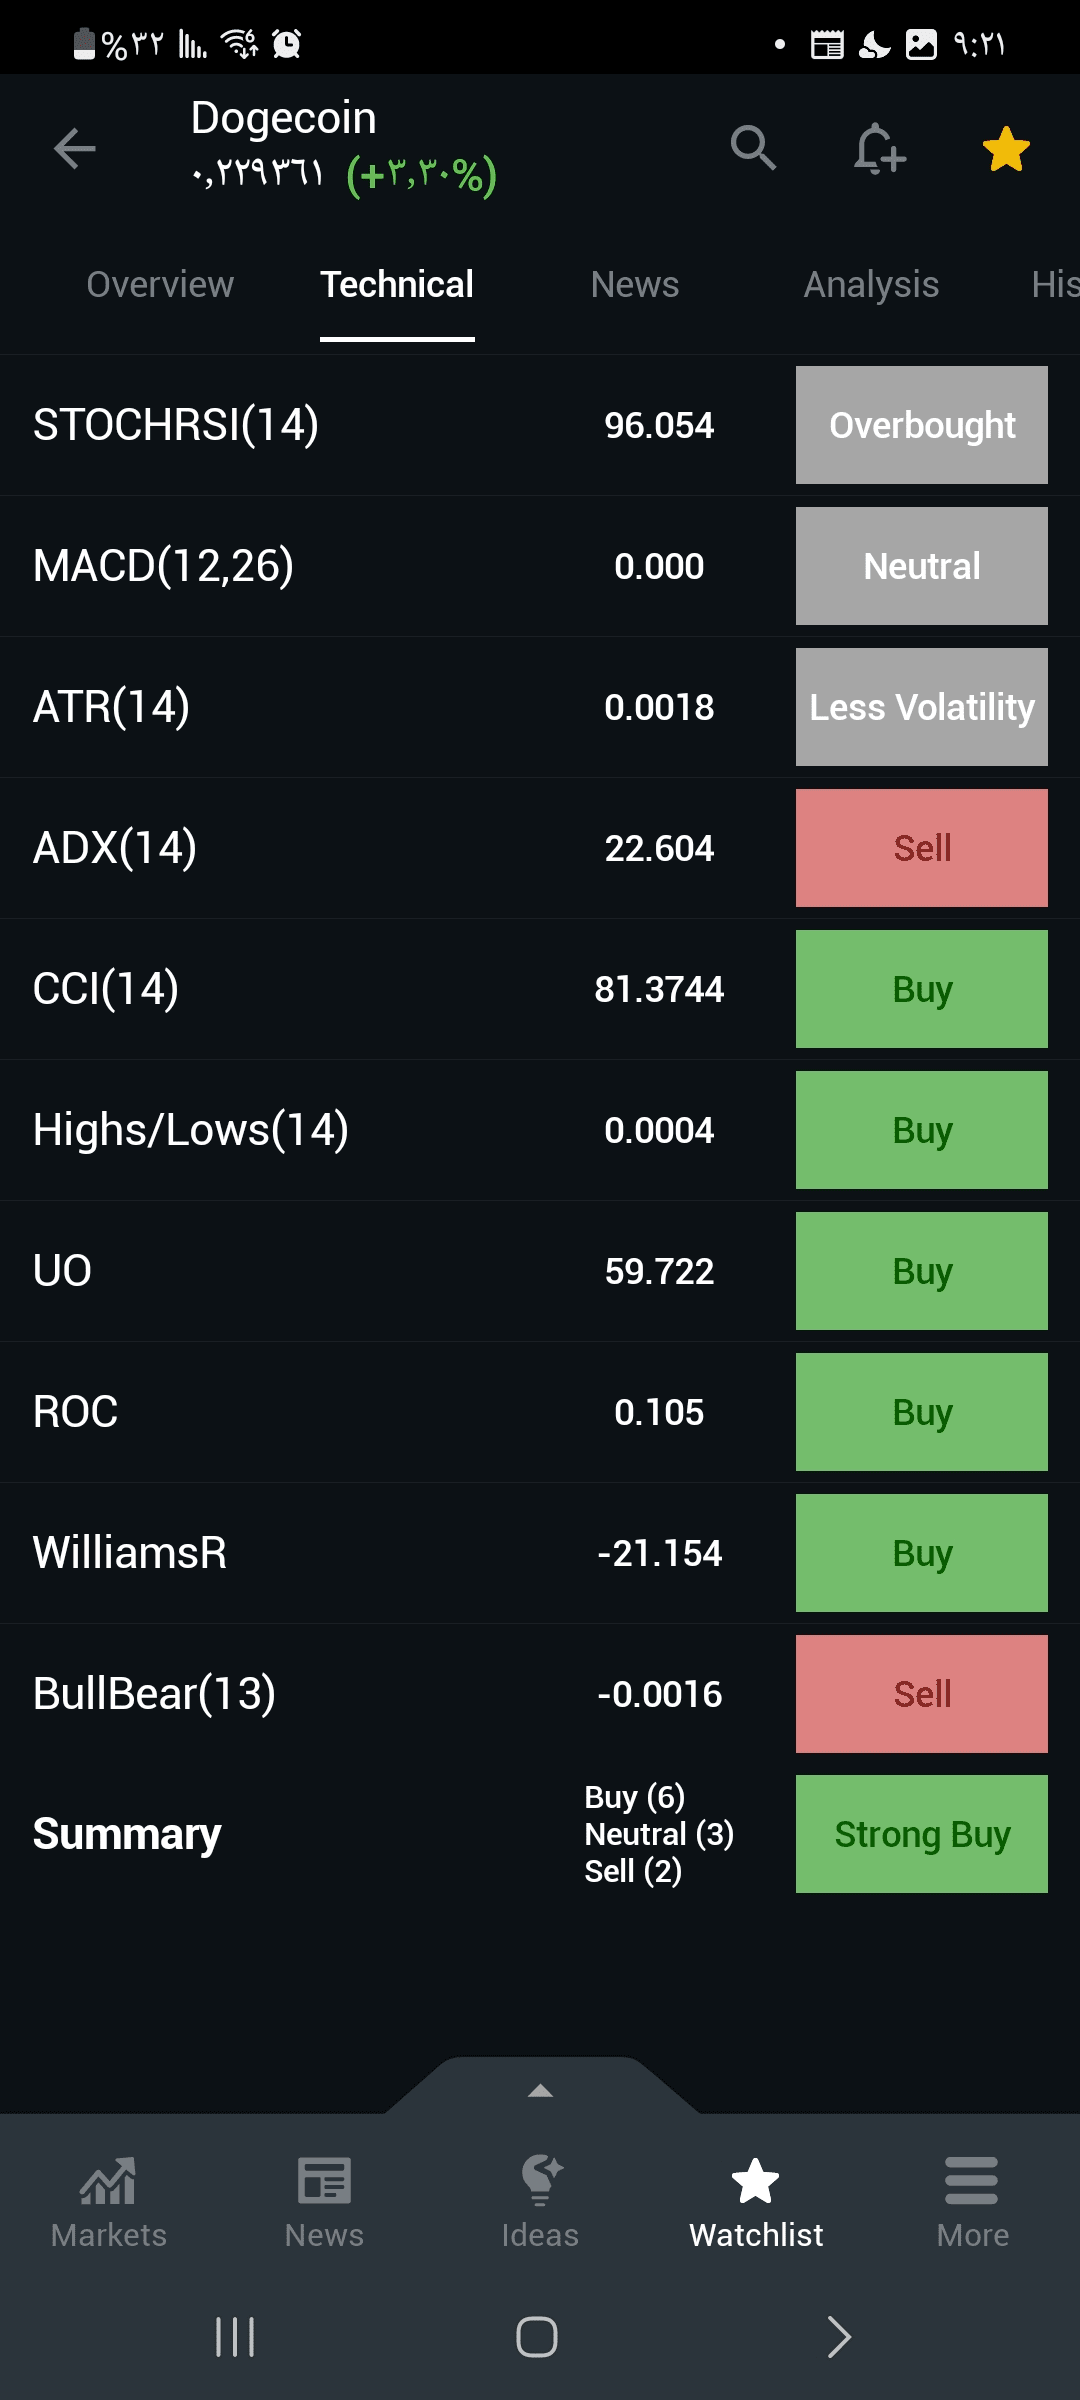
- CCI(14): **81.37** (buy - bullish strength).
- ROC: **+0.105%** (positive momentum).
- **Buying volume**: Most sub-indicators (UO, Highs/Lows) support the rise.
2. **Main risks**:
- **STOCHRSI(14): 96.054** → **Severe overbought** (highest level since previous analyses).
- **ADX(14): 22.604** → **Weak trend** (below 25) despite bullish signals.
- **Oscillators**:
- MACD: 0.000 (neutral) - absence of strong support.
- Williams %R: -21.154 (buy) but close to the overbought area.
---
### ✅ Answering the questions:
1. **Is there bullish momentum?**
- **Yes**, but it's in the **last overbought phase** (STOCHRSI 96 > 80).
- Evidence:
- Dominance of buy signals (9/12 in moving averages, 6/11 in indicators).
- RSI(14) improved to 50.892 (neutral but upward trend).
2. **Is it time to buy or sell?**
- **🔴 Avoid direct buying now** (due to strong overbought).
- **🟢 Gradual strategy**:
- **Buy at support**: **S1 (0.228305)** or **S2 (0.227716)** with a stop loss below **S3 (0.227287)**.
- **Sell at resistance**: **R1 (0.229323)** or **R2 (0.229752)** for quick profits.
- **Ideal scenario**:
- Wait for **correction to 0.2283** then enter a buy.
- If **R2 (0.229752)** is broken: enter a buy targeting **R3 (0.230341)**.
---
### 📌 Trading Recommendation:
| **Action** | **Level** | **Target** | **Stop Loss** |
|-------------------|-----------------|-----------------|------------------|
| **Buy (Buy Limit)** | 0.2283 - 0.2285 | R1: 0.2293 → R2: 0.2297 | 0.2276 (below S2) |
| **Sell (Take Profit)** | 0.2297 - 0.2300 | R3: 0.2303 | Above 0.2305 |
| **Avoid short selling** | - | - | - |
---
### ⚠️ Critical Notes:
1. **Risk management**:
- Reduced volatility (ATR: 0.0018) → Limited price movements.
- Reward/Risk ratio **1:2+** when buying from support.
2. **Bullish catalysts**:
- Breaking **R2 (0.229752)** with high trading volume.
- STOCHRSI drop below 80 (reducing overbought).
3. **Warning**:
> Any failure to break R1 (0.229323) may cause a correction to **0.2277 (S2)**.
---
### Summary:
- **Short-term trend**: Bullish with **risk of technical correction** due to overbought (STOCHRSI 96).
- **Expectations**:
- Base scenario: **Correction to 0.2283** then bounce towards 0.2303.
- Alternative scenario: Breaking R2 drives the price to 0.231+.
- **Recommendation**:
- **Wait to buy at support** (0.2283) or **sell at resistance** (0.2297).
- Avoid long positions above 0.2295 until overbought calms down.
> 📉 **Current risk**: Medium (3/5) - entry needs precise timing.