Based on the technical data in the three new images dated today 19/82025, here’s the detailed analysis:
---
### **Key Technical Indicators**:
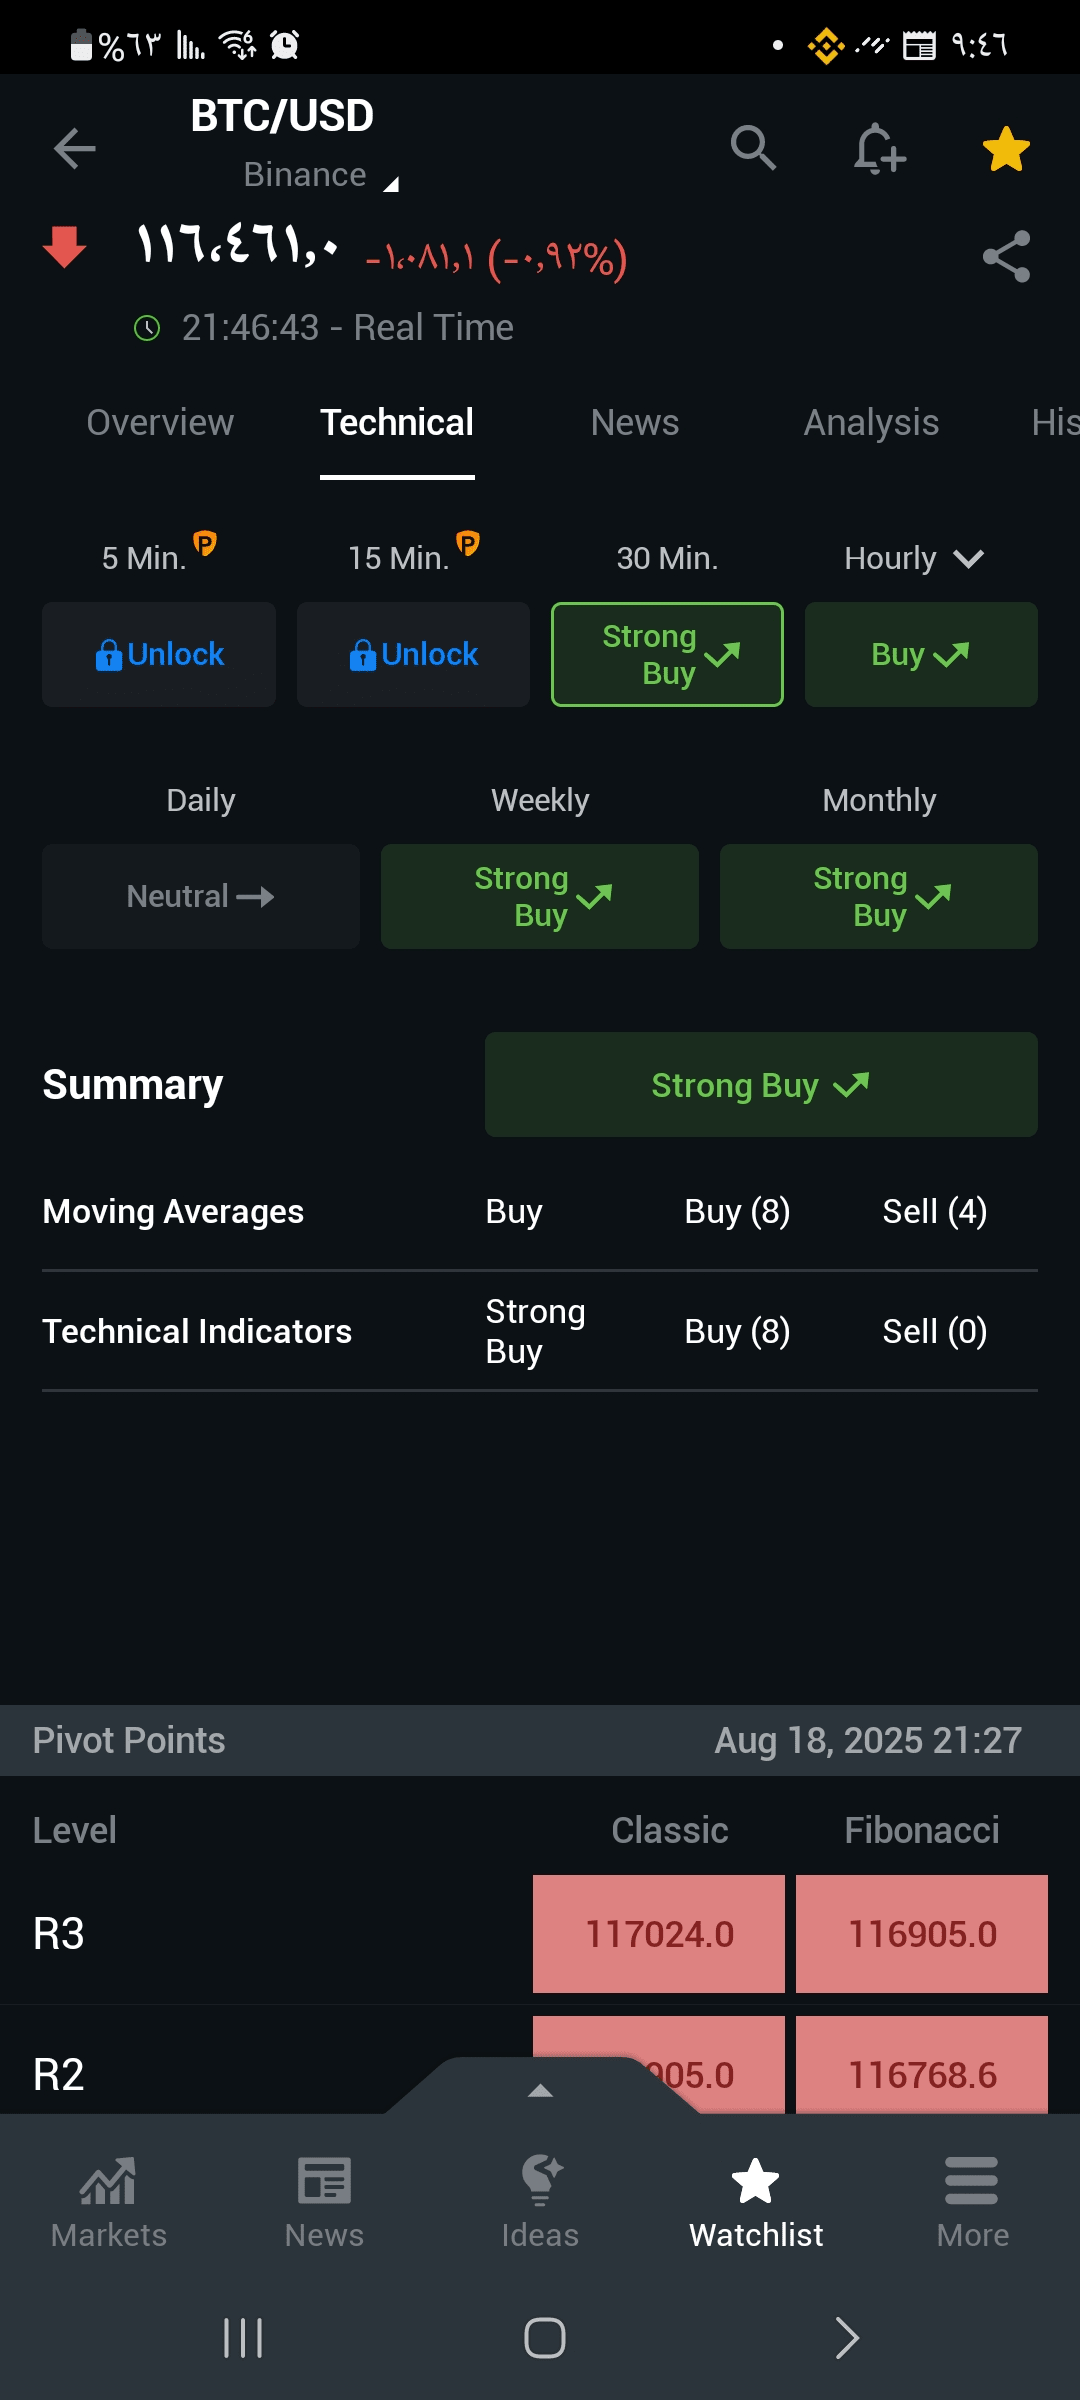
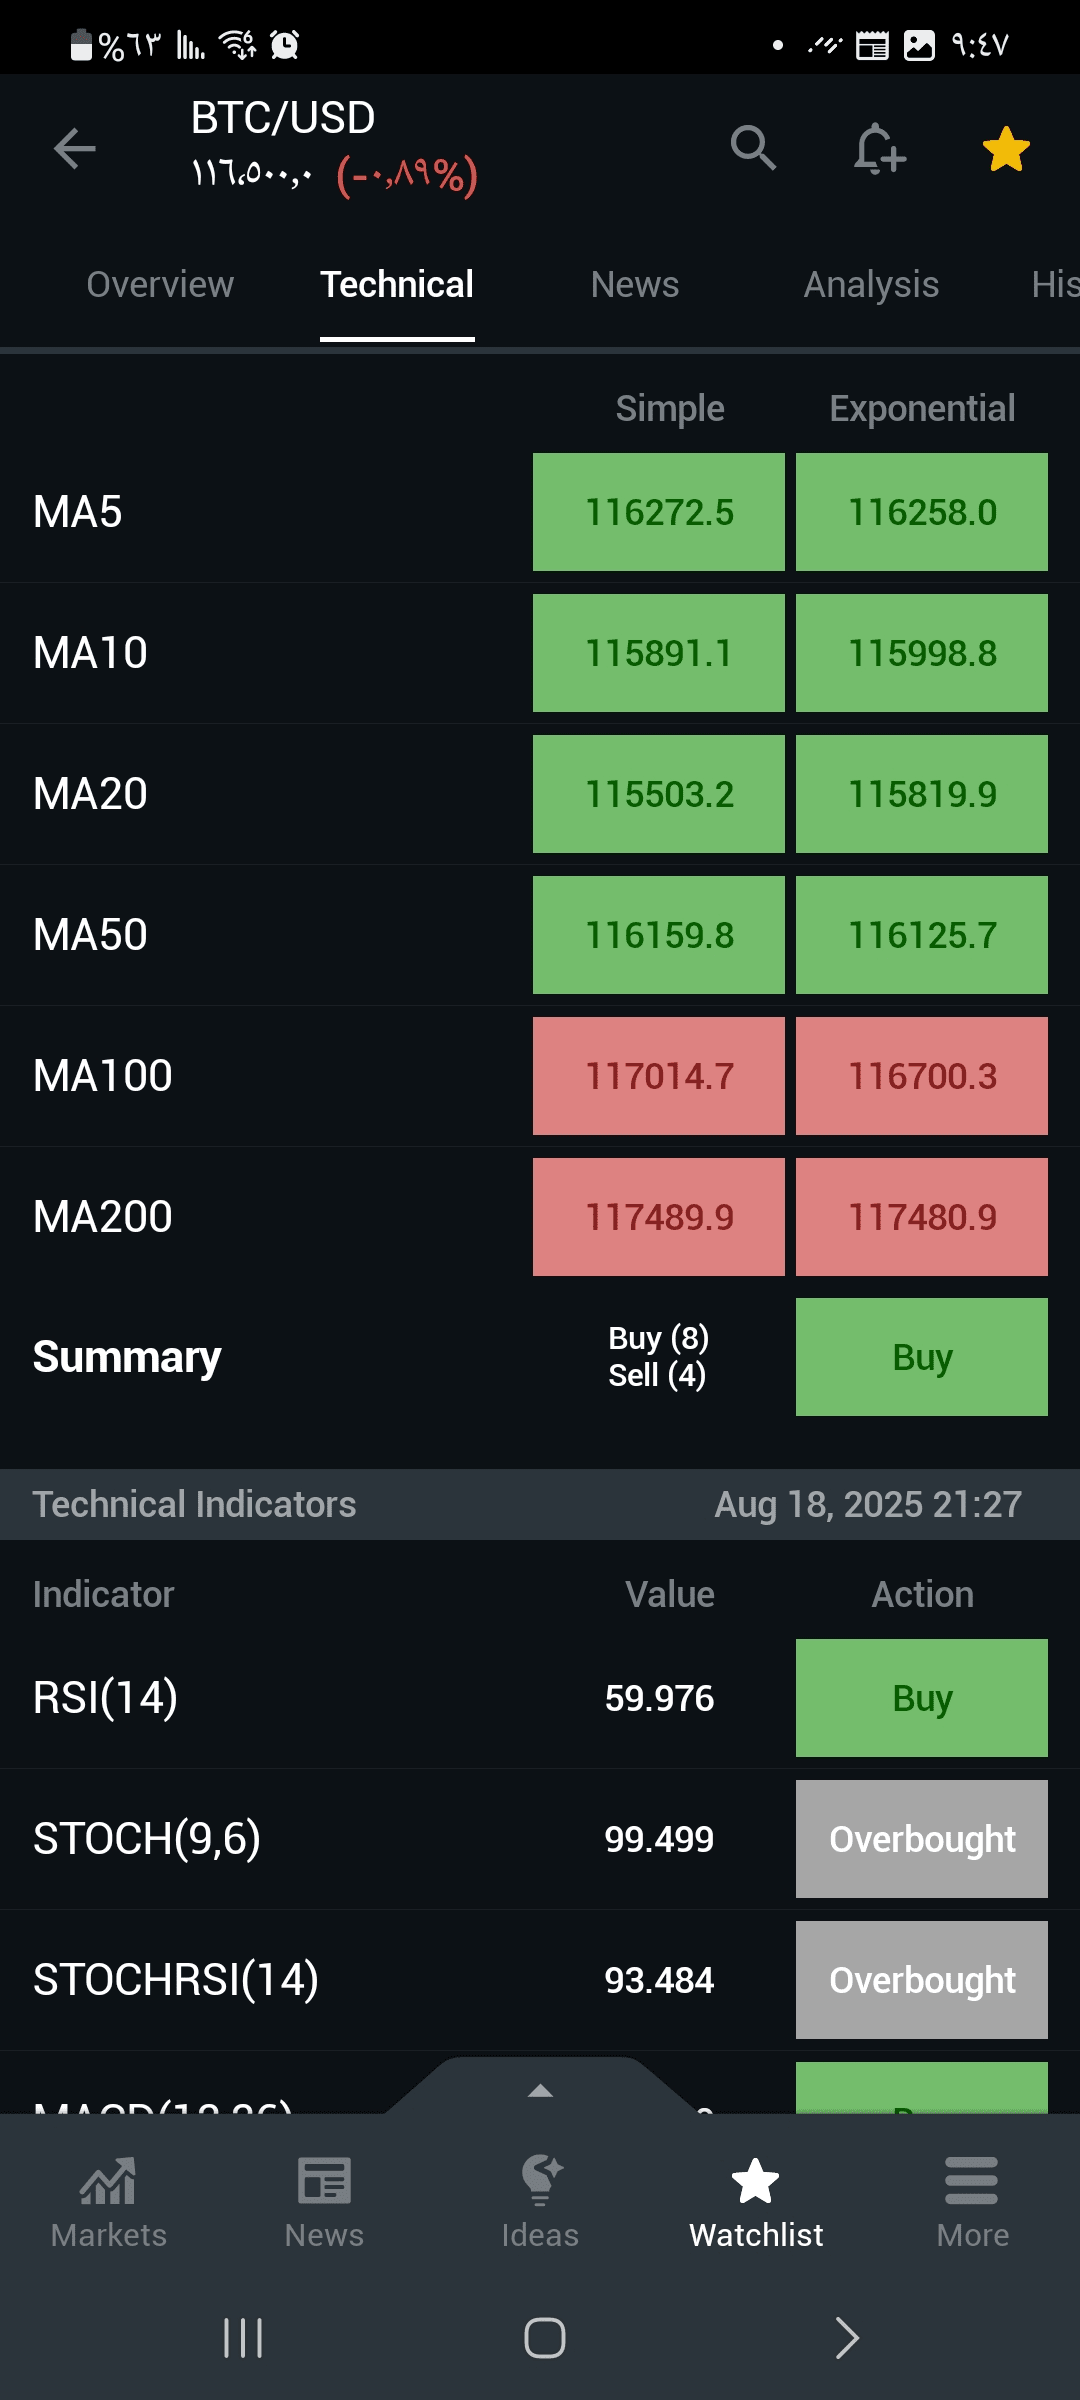
1. **Moving Averages Trend**:
- **8 buy signals** against 4 sells in simple moving averages.
- Current price (~116,272) **above MA10 (115,891) and MA20 (115,503)** → bullish signal.
2. **Main Momentum Indicators**:
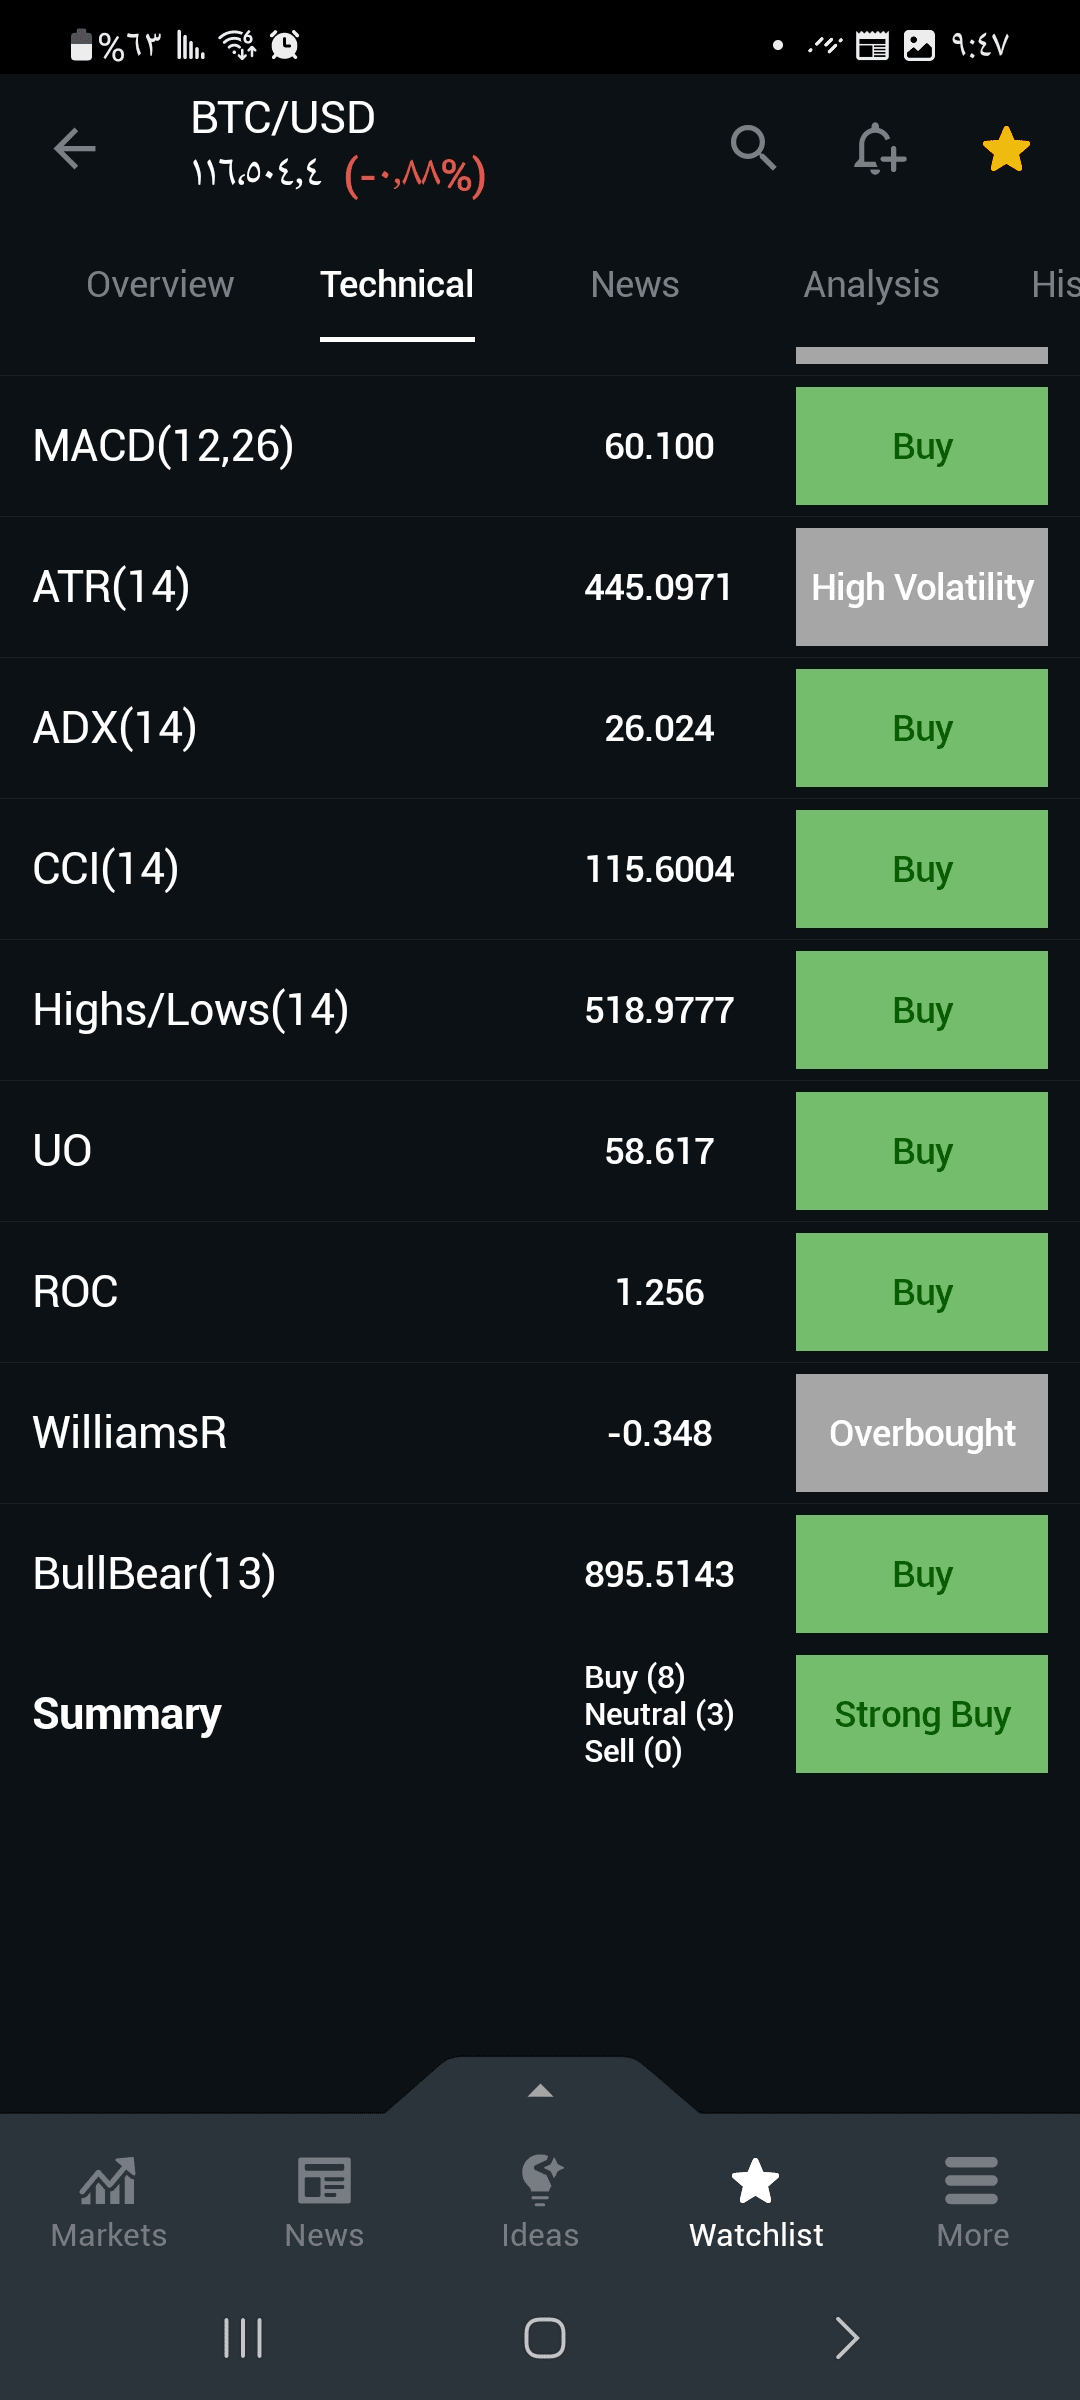
- **MACD(12,26): 60.100** (Strong **buy signal**).
- **ADX(14): 26.024** (Bullish trend has started gaining strength above level 25).
- **CCI(14): 115.6004** (Above 100 → bullish momentum).
3. **Overbought Indicators**:
- **STOCH(9,6): 99.499** (Severely Overbought).
- **Williams %R: -0.348** (Overbought).
- **STOCHRSI(14): 93.484** (Overbought) → Warning of a potential short-term correction.
4. **Volatility and Support/Resistance**:
- **ATR(14): 445.0971** (High volatility → opportunities for strong movements).
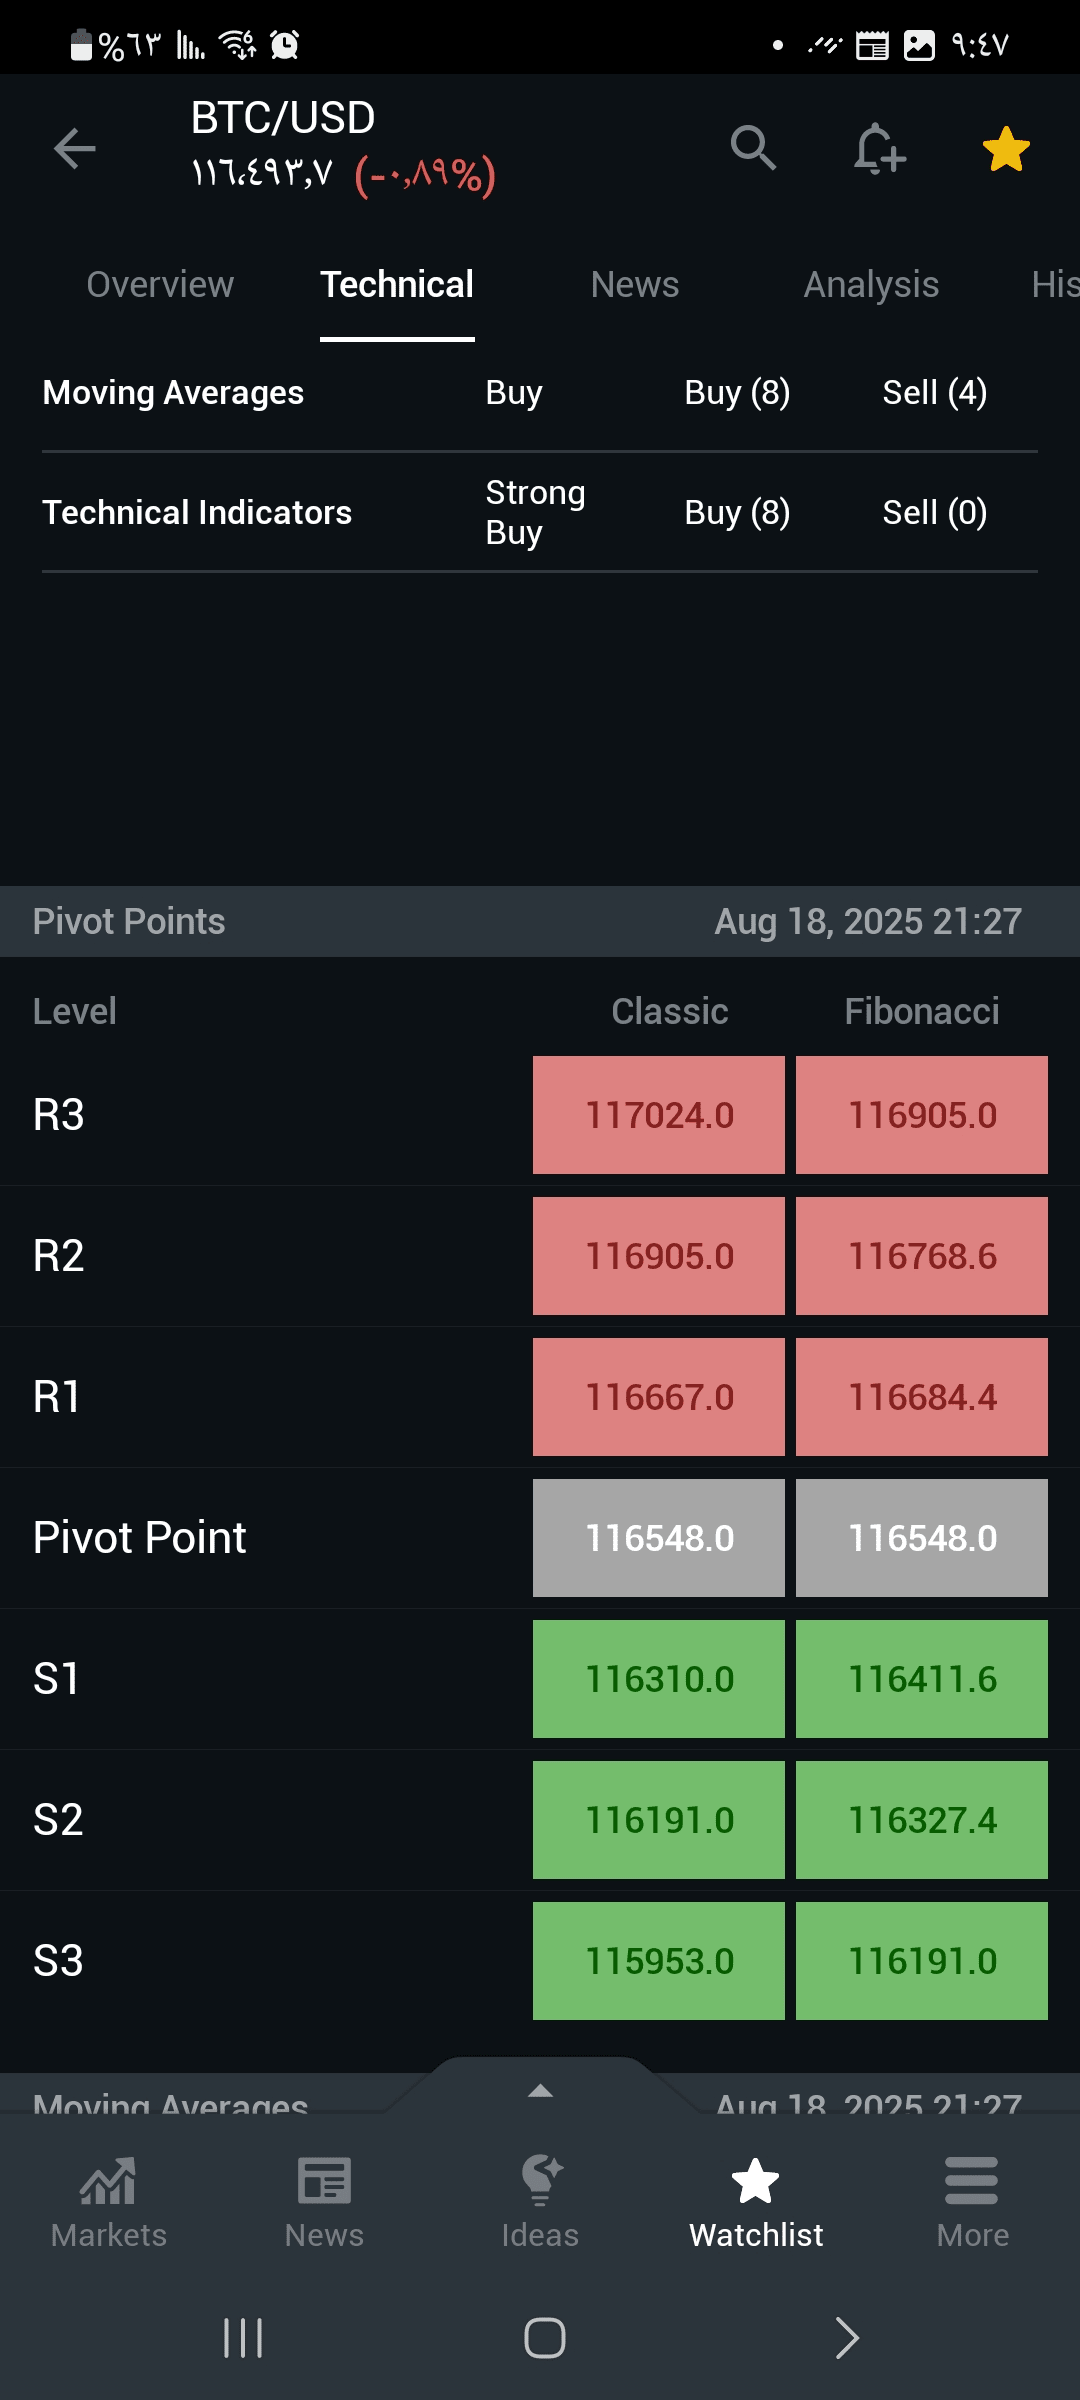
- Pivot Points:
- Support: **116,310 (S1)** then **116,191 (S2)**.
- Resistance: **116,667 (R1)** then **116,905 (R2)**.
---
### **Price and Momentum Forecast**:
- **General Trend**: **Bullish (↑)** with:
- **80% of indicators indicate buy** (8 buy signals versus 0 sells in the last image).
- Support from short-term averages and momentum indicators (MACD, ADX, CCI).
- **Risks**:
- Overbought indicators (STOCH, Williams %R) indicate a potential **short-term correction** towards **116,310 - 116,191** before resuming the upward trend.
- Breaking below **116,191 (S2)** may change the trend.
- **Target Levels**:
- **Short Target**: 116,667 (R1) → breaking it opens the way for 116,905 (R2).
- **Medium Target**: 117,024 (R3) if momentum continues.
---
### **Strategic Recommendation**:
| Action | Details |
|----------------|--------------------------------------------------------------------------|
| **Buy** | - **Optimal level**: when correcting near **116,310 (S1)** or **116,191 (S2)**. - **Stop Loss**: below **116,000** to protect capital. - **Target**: 116,667 then 116,905. |
| **Avoid Selling** | - No strong sell signals (0 sell signals in indicators). - Only sell if the price breaks **116,000** with confirmation of high trading volume. |
| **Risk Management** | - Risk/Reward Ratio: 1:3 (Acceptable). - Reduce size due to high volatility (ATR > 445). |
> **Summary**:
> **Momentum is bullish with a good buying opportunity**, but wait for a slight correction (5-10 minutes) for a better entry. Avoid large positions due to overbought signals.