🔍 Current situation
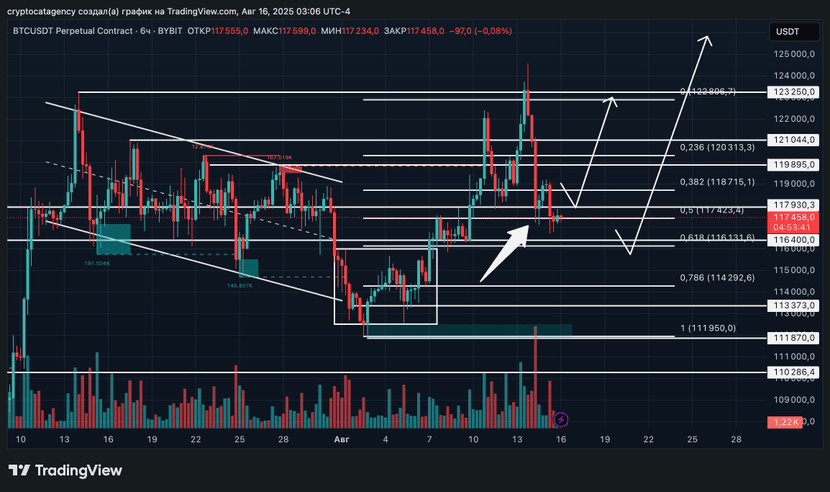
- Price $BTC : Holds above critical support $115,000, keeping chances for growth to $125,000.
- Technical levels:
- Support: $115,000 (psychological level), $112,680 (next stronghold).
- Resistance: $120,300 (Pivot High), $124,500 (historical maximum).
- Indicators:
- RSI (14): 56.3 (neutral zone, no overbought).
- MACD: Decreasing bearish histogram — possible short-term upward momentum.
📈 Optimistic scenario
Conditions: Holding above $115,000 + breaking $120,300 with volume.
Goals:
1. $122,300 (nearest resistance).
2. $124,500–125,000 (test ATH).
Drivers:
- Institutional demand through ETF (inflow of $1.23 billion for the week).
- Positive macro data (CPI inflation 12.08).
📉 Pessimistic scenario
Conditions: Falling below $115,000 + closing daily candle below this level.
Goals:
1. $112,680 (FVG zone).
2. $100,000 (major support, psychological level).
Risks:
- Outflow from ETF (-$14.1 million per day).
- Tightening of regulatory policy.
🔄 Likely sideways
Range: $115,000–120,000.
Reasons:
- Waiting for key news (Fed decisions, inflation data).
- Consolidation after sharp rise to ATH.
Strategy:
- Buying on pullbacks to $115,000–116,000 (stop-loss below $112,000).
- Profit taking at $120,000–122,000.
💡 Conclusion
- Base scenario (60%): BTC tests $125,000 after holding $115,000.
- Alternative (30%): Correction to $100,000 upon breaking support.
- Short-term sideways (10%): Consolidation in $115,000–120,000 until September.
> Key trigger: Inflation data (CPI) 12.08 — will determine the further trend.
