Family! Early morning$ETH Breakthrough the $4050 mark🔥 Combined with the latest 15-minute K-line chart, let's deeply analyze the market logic:
According to real-time data from OKX, ETH/USDT is currently reported at 4025.10, with a 5-minute increase of 0.14%. Let's analyze from a technical perspective -

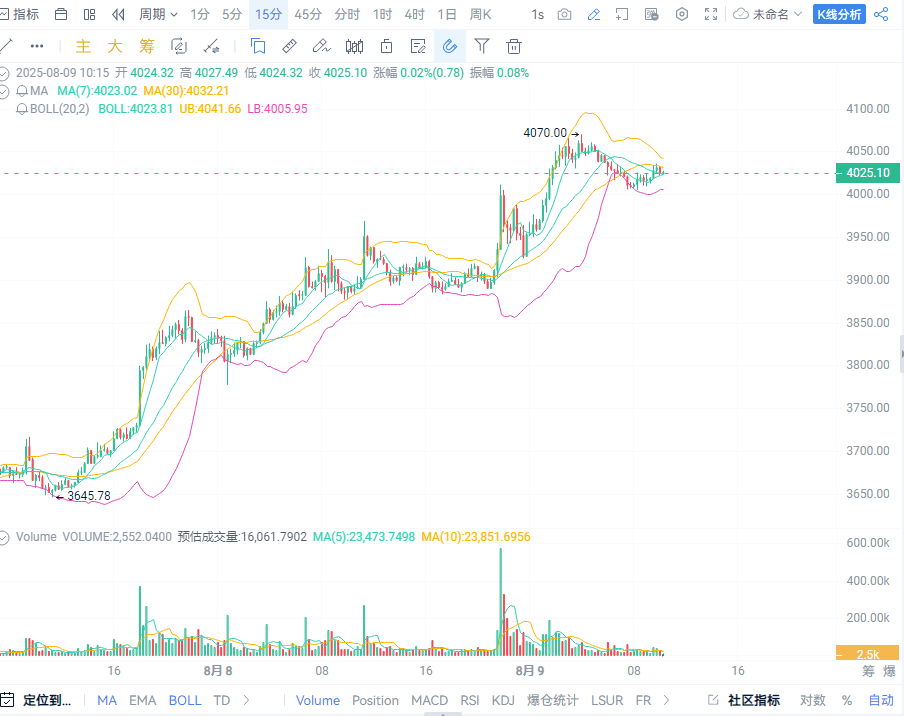
Moving averages and trends: Bullish structure remains, but beware of divergences
Currently, the 7-day moving average (MA7:4023.02) and the 30-day moving average (MA30:4032.21) are continuously diverging upwards, forming bullish support, indicating that the short-term trend remains unchanged. But pay attention to the K-line trend: after breaking through 4050, the price encountered resistance at 4070 and fell back, currently oscillating around the moving averages, with bulls and bears beginning to contest. We need to observe whether the moving averages can continue to support the price upward.
Bollinger Bands signal: Upper band pressure is evident, beware of pullback consolidation
In the Bollinger Bands (BOLL(20,2)), the middle band (BOLL:4023.81) is firmly supportive, while the upper band (UB:4041.66) previously formed strong resistance at 4070. The current price is oscillating in the upper part of the Bollinger Bands, with upper band pressure and moving average support creating a tug-of-war: if it can break through the upper band with increased volume, we can look at 4100+; if the volume is insufficient, it is highly likely to pull back to the middle band (around 4023) for consolidation.
Volume change: After a surge, we need to pay attention to sustainability
Trading volume (Volume) shows a phased increase, with MA(5) and MA(10) volume moving averages gently trending upwards, indicating active capital pushing. However, when it surged to 4070, the volume did not further explode, but instead fell back with decreased volume, suggesting short-term profit-taking. We need to closely monitor the volume: if it surges again, it will be a breakout signal; if it continues to decrease, the risk of a pullback increases.
Key resistance and support: 4050 is the dividing line for bulls and bears
Resistance level: 4050 - 4070 is the previous breakout range and also a psychological barrier. If it can firmly hold above 4050 and increase in volume, the probability of attacking 4100 is high;
Support level: Look towards the middle band of the Bollinger Bands (4023) and the 30-day moving average (4032). If it pulls back and stabilizes here, the bulls still have a chance to counterattack.
Operational advice: Keep a close watch on key signals, don't blindly chase highs
For friends wanting to get in, a phased strategy is more stable:
For determined bulls: If the price can hold above 4050 and volume increases, enter with light positions, set a stop-loss at 4020 (if it breaks below the moving average support, then exit);
For conservative observers: Wait for a pullback to the 4020 - 4030 range, confirm the support is effective before positioning for a potential second attack.
ETH short-term volatility is increasing, but the trend has not completely deteriorated. Do you think this wave is 'breakthrough consolidation' or 'surge and pullback'? Let's discuss in the comments and catch the market rhythm.
#eth突破4000 #特朗普加密新政 #ETH巨鲸增持 #加密股IPO季 #ETH
Keep an eye on OG FIO HEI A2Z BB
