This morning I realized that Bitcoin, Ethereum, and altcoins all corresponded one by one!
Today’s article analyzes the four-year cycle of Bitcoin and the past and present of Ethereum and altcoins one by one!
Everyone is welcome to take screenshots as proof; this article will be pinned long-term!

I. Key Time Nodes: Time is more important than position
Gann theory believes that time is more important than position!
(1) September 5-11, 2025, around September 15, 2025
(2) October 2025, November-December 2025.
(3) September 2026 or December 2026
(4) November-December 2028-2030
II. The four-year cycle is still ongoing: Bitcoin's secret chart
The four-year cycle of Bitcoin is indeed still ongoing, but because Bitcoin has become a component stock of beautiful stocks, the boundaries are no longer so clear, becoming very blurred!
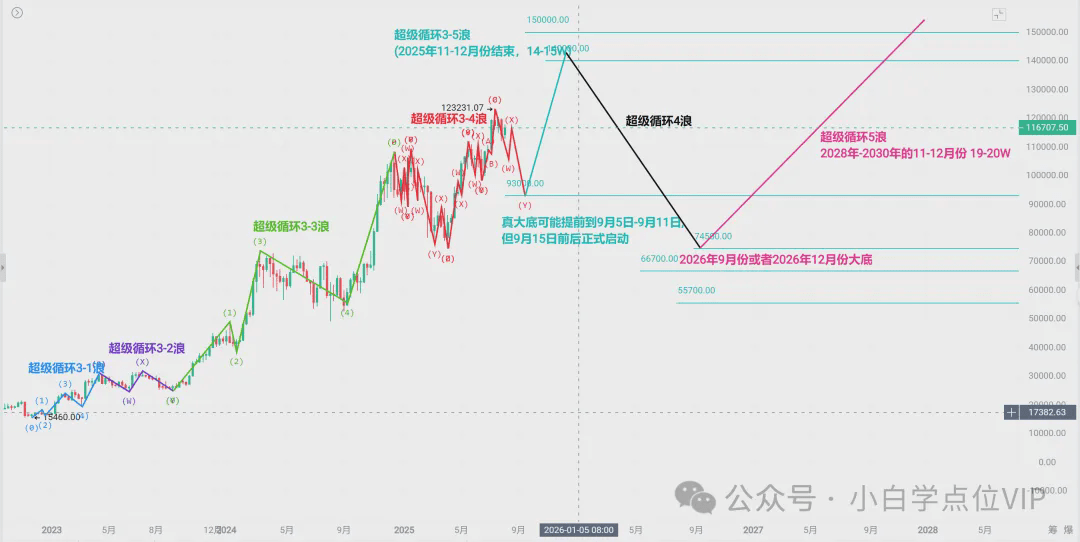
Currently in the decline of the super cycle 3-4-Z wave, after the end of the super cycle 3-4-Z decline is the super cycle 3-5 wave.
The true bottom of the super cycle 3-5 wave may advance to start between September 5-11, 2025, but the real explosion of the super cycle 3-5 wave will occur around September 15, 2025.
The super cycle 3-5 wave originates from interest rate cut speculation, ideally ending in November-December 2025, and will not end until after October 2025 at the earliest.
After the end of the super cycle 3-5 wave is the super cycle 4 wave, with the super cycle 4 wave expected to decline to 74500 in September 2026 or December 2026, with extremes between 55700-66700.
After the end of the super cycle 4 wave, it is the super cycle 5 wave, with the target of the super cycle 5 wave in November-December 2028-2030, located at 19-20-22.5W.
III. The rebirth of the small bull: Ethereum's secret chart
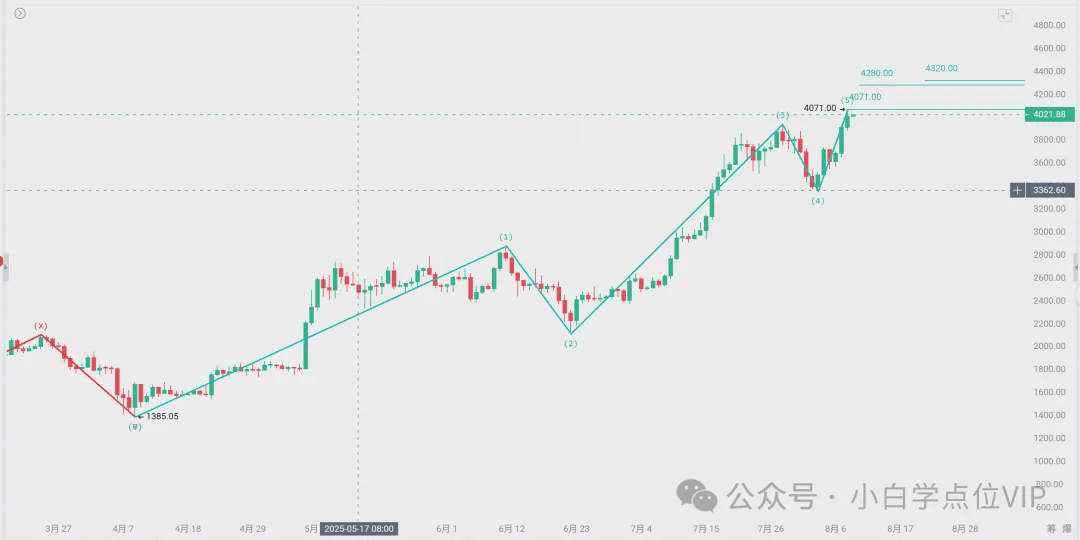
【Short-term Trend of Ethereum】As shown in the figure above, the super cycle 1-4-XX-A wave has already completed the internal sub-5 waves, currently within the sub-5 wave, with a bottleneck at 4071 (August 9), the monthly Bollinger upper band at 4280-4320 (around August 11), potentially extreme to 4484.67, even 4817.57, but will not exceed 5183.39.
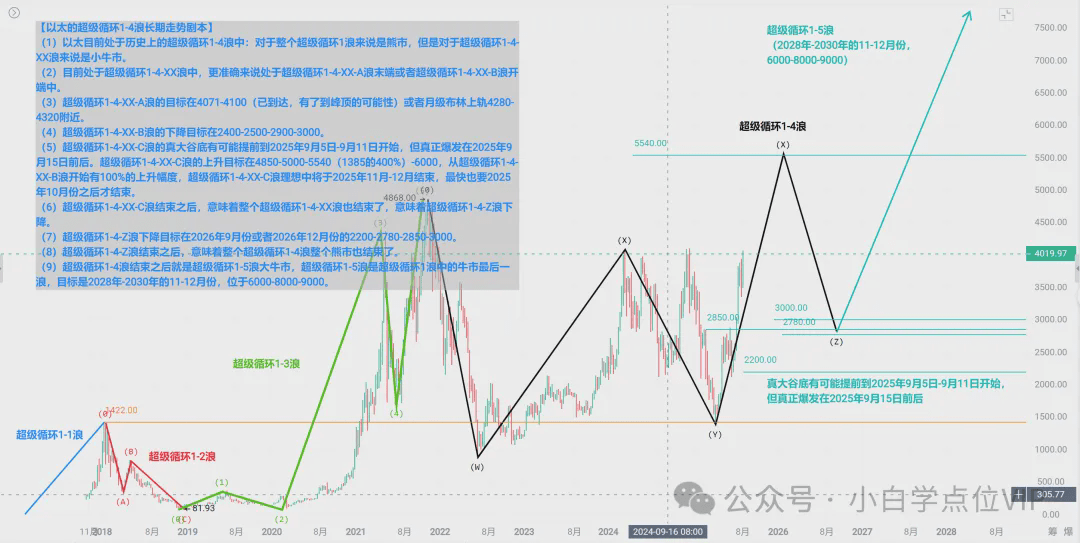
【Long-term Trend Script of Ethereum's Super Cycle 1-4 Wave】
(1) Ethereum is currently in the historical super cycle 1-4 wave: for the entire super cycle 1 wave, it is a bear market, but for the super cycle 1-4-XX wave, it is a small bull market.
(2) Currently in the super cycle 1-4-XX wave, more accurately at the end of the super cycle 1-4-XX-A wave or the beginning of the super cycle 1-4-XX-B wave.
(3) The target of the super cycle 1-4-XX-A wave is 4071-4100 (already reached, with the possibility of reaching the peak) or near the monthly Bollinger upper band at 4280-4320, potentially extreme to 4484.67, even 4817.57, but will not exceed 5183.39.
(4) The downward target of the super cycle 1-4-XX-B wave is at 2400-2500-2900-3000.
(5) The true bottom of the super cycle 1-4-XX-C wave may advance to start between September 5-11, 2025, but the real explosion will happen around September 15, 2025. The upward target of the super cycle 1-4-XX-C wave is at 4850-5000-5540 (400% of 1385)-6000, starting from the super cycle 1-4-XX-B wave with a 100% increase, ideally ending in November-December 2025, and will not end until after October 2025 at the earliest.
(6) After the end of the super cycle 1-4-XX-C wave, it means that the entire super cycle 1-4-XX wave also ends, indicating the decline of the super cycle 1-4-Z wave.
(7) The downward target of the super cycle 1-4-Z wave is at 2200-2780-2850-3000 by September or December 2026.
(8) After the end of the super cycle 1-4-Z wave, it means that the entire super cycle 1-4 wave bear market also ends.
(9) After the end of the super cycle 1-4 wave comes the super cycle 1-5 wave bull market, the super cycle 1-5 wave is the last wave of the bull market in the super cycle 1 wave, targeting November-December 2028-2030, located at 6000-8000-9000.
IV. The Long Bear Road: The Secret Chart of Altcoins
Whether altcoins are in a bear or bull market should not be judged by Bitcoin or Ethereum; they must be analyzed separately. The final judgment of whether altcoins are in a bear or bull market relies solely on three secret charts!
The three secret charts were first proposed in the article (98399.23 re-enlightened, this is just the beginning and not the end! The bear road is long, when will there be a season for fish, shrimp, and crabs? The three secret charts reveal the brutal truth!)
Bitcoin is Bitcoin, Ethereum is Ethereum, stablecoins are stablecoins, and ordinary altcoins are ordinary altcoins! Don't think that the bull market for altcoins has arrived just because Bitcoin and Ethereum are strong; the truth is far from what you imagine!
Conclusion: Altcoins are currently still in a bear market and not in a bull market!

What standard should be used to quantify the performance of altcoins? This chapter is very important, everyone should read it carefully!
(1) The bottom period of the bear to bull transition
The bottom building period of the bear to bull transition refers to the 【last wave of small bulls appearing, the decline is no longer so huge as to cause despair, with a very obvious bottom that anyone can recognize as the lowest point, and the larger the market cap, the more apparent the bottom. However, this stage will repeatedly cause annoying horizontal fluctuations, and many will not escape the horizontal fluctuation range for a long time】.
This is the accumulation period for the Zhuang family, the most grueling time, which can easily wash people out of their positions. It can be comprehensively connected using wave theory + Gann theory + Wyckoff accumulation model + Chan theory + high win rate trading models. The real launch phase of the bull market will only come after the bottom-building period!
Historically, the bottom building period for the bear to bull transition is 8-9 months. Can you endure it?
(2) Overall situation of ordinary fish, shrimp, and crabs secret chart (fish, shrimp, and crabs within the top 50 market cap)
To analyze the overall situation of fish, shrimp, and crabs, it is necessary to exclude the Bull Demon King, concubines, and various stable fish, shrimp, and crabs from the overall market cap of fish, shrimp, and crabs in the blockchain continent; this is the true overall market cap situation of ordinary fish, shrimp, and crabs.
In theory, XRP and BNB, two very large market cap fish and crabs, should also be excluded; otherwise, it will lead to a certain degree of distortion. However, in actual operation, I do not see chart data sources that meet my requirements, so I can only give up.
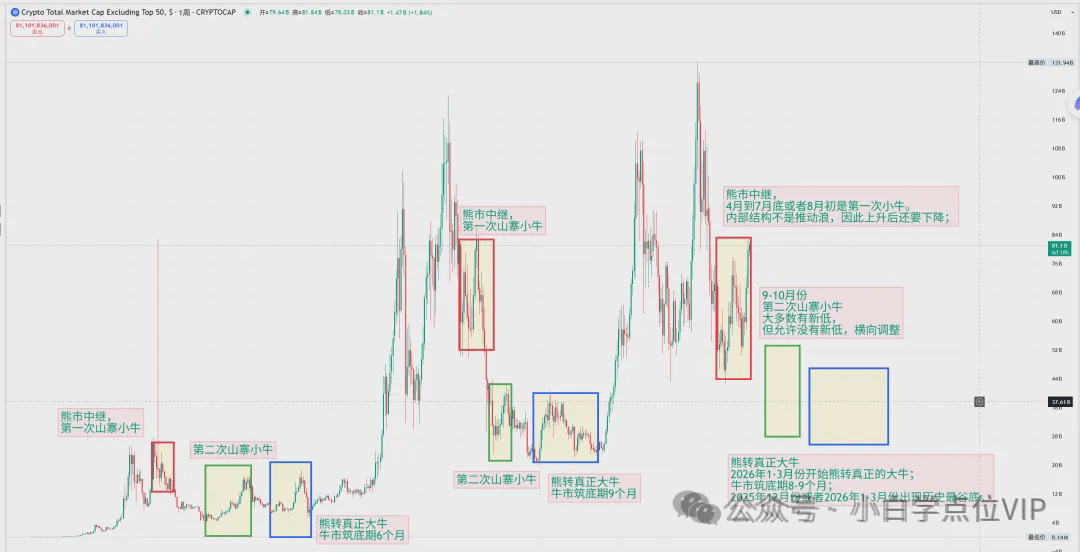
As shown in the figure, everyone should understand it well, the latest chart has been updated, this chart represents the overall situation of the top 50 market cap fish, shrimp, and crabs:
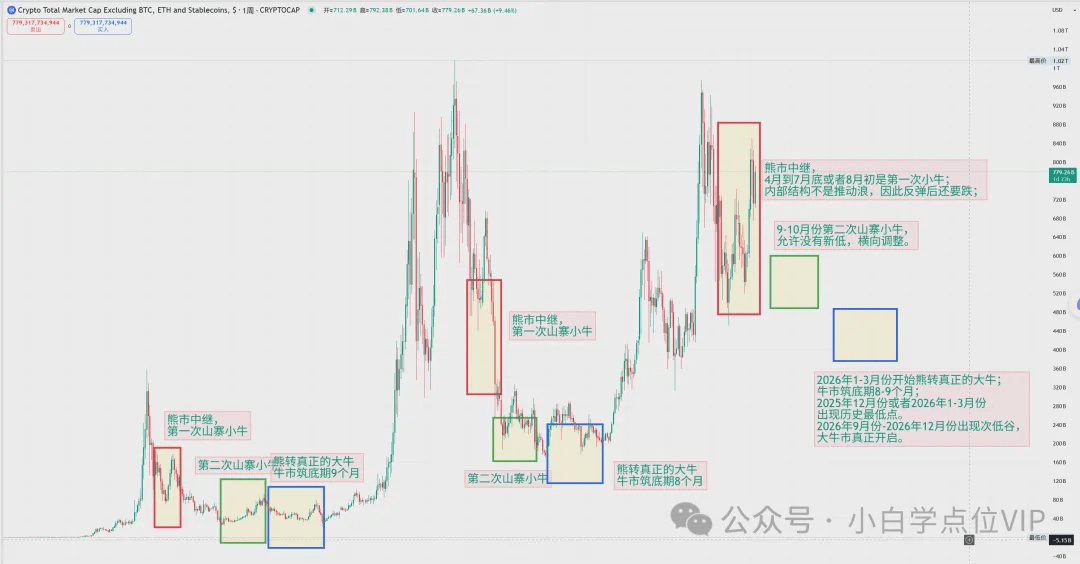
Currently still in the bear market that started in March 2024.
From April to the end of July or early August is the first small bull. The internal structure is not a driving wave, so after rising, it will also decline;
In September-October, the second small bull for fish, shrimp, and crabs will occur, allowing for no new lows, with horizontal adjustments.
The bear to bull transition will start between January-March 2026; the bull market bottom building period lasts 8-9 months;
The historical lowest point will appear in December 2025 or January-March 2026.
A second low will appear between September 2026 and December 2026, marking the real start of the bull market.
(3) Small-cap fish, shrimp, and crabs situation secret chart (market cap 50-100 fish, shrimp, and crabs)
Based on the overall market cap situation of ordinary fish, shrimp, and crabs, after excluding the top 50 fish, shrimp, and crabs by market cap, we get the overall situation of small-cap fish, shrimp, and crabs with a market cap of 50-100, as shown in the figure, everyone should understand it well, the latest chart has been updated:
Currently still in the bear market that started in March 2024.
From April to the end of July or early August is the first small bull. The internal structure is not a driving wave, so after rising, it will also decline;
In September-October, the second small bull for fish, shrimp, and crabs will occur, with most having new lows, but allowing for no new lows, with horizontal adjustments.
The bear to bull transition will start between January-March 2026; the bull market bottom building period lasts 8-9 months;
The historical lowest point will occur in December 2025 or January-March 2026.
A second low will appear between September and December 2026, marking the real start of the bull market.
The overall rise of small-cap fish, shrimp, and crabs in the small bull is slightly worse than the overall market cap situation of ordinary fish, shrimp, and crabs, indicating that if you are not sure, the market cap of the top 50 fish, shrimp, and crabs in the bear market small bull is better value for money and more certainty.
(4) Micro-cap fish, shrimp, and crabs situation secret chart (fish, shrimp, and crabs after the 100th market cap)
Based on the overall market cap situation of ordinary fish, shrimp, and crabs, after excluding the top 100 fish, shrimp, and crabs by market cap, we get the overall situation of micro-cap fish, shrimp, and crabs after the 100th market cap, as shown in the figure, everyone should understand it well, this picture is the most worth our repeated study, the latest chart has been updated:
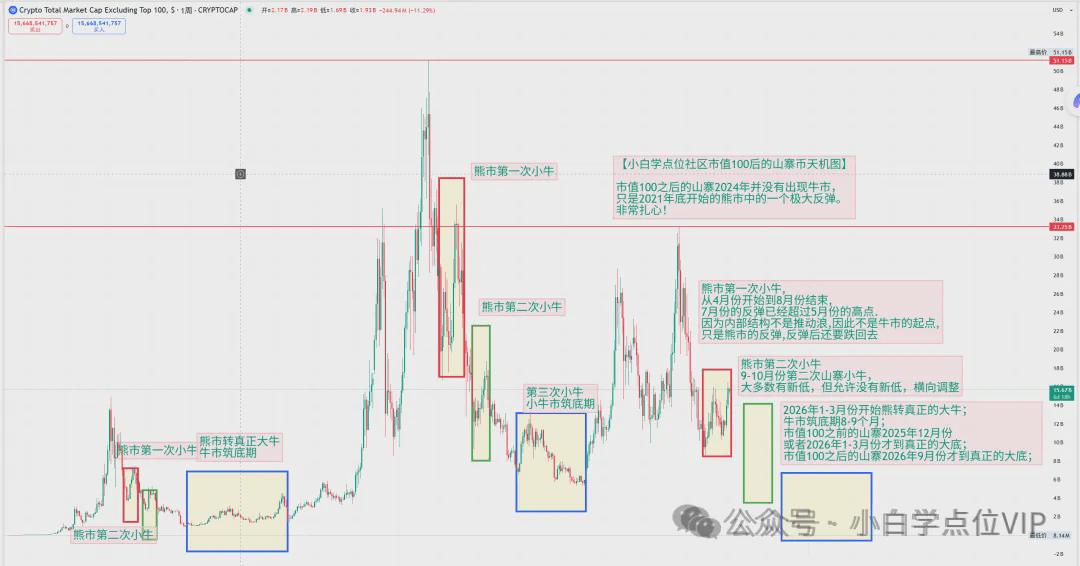
Micro-cap fish, shrimp, and crabs after reaching the 100th market cap did not see a bull market in 2024, only a significant rise in the bear market that started at the end of 2021, which is very painful and despairing.
Currently still in the bear market that started at the end of 2021.
From April to the end of July or early August is the first small bull. The internal structure is not a driving wave, so after rising, it will also decline;
In September-October, the second small bull for fish, shrimp, and crabs will occur, with most having new lows, but allowing for no new lows, with horizontal adjustments.
The bear to bull transition will start between January-March 2026; the bull market bottom building period lasts 8-9 months;
The true bottom will come between September 2026 and December 2026, marking the real start of the bull market.
Micro-cap fish, shrimp, and crabs in the small bull have a much worse overall rise than small-cap fish, shrimp, and crabs, indicating that if you are not sure, it is not recommended to associate with fish, shrimp, and crabs after the 100th market cap during the bear market small bull, as the uncertainty is high, and they are likely to follow the decline rather than the rise.
(5) Conclusion
The way of heaven has a cycle, if the boat cuts the sword is valid, my suggestion is:
<1> In September-October 2025, fish, shrimp, and crabs will experience a second small bull. If you are unsure during the small bull period, it is recommended to associate with fish, shrimp, and crabs within the top 50 market cap, followed by those in the top 100, and not to associate with those after the 100th market cap.
In December 2025 or January-March 2026, there will be a third small bull. If you are unsure during the small bull period, it is recommended to associate with fish, shrimp, and crabs within the top 50 market cap, followed by those in the top 100, and not to associate with those after the 100th market cap.
<3> After the end of the third small bull, the period between September-October 2026 (at the latest by December 2026) will be the bottom building period for the transition from bear to bull market, where reasonable allocation of the Bull Demon King, concubines, fish, shrimp, and crabs in the top 50 market cap, top 100 market cap, and those after the 100th market cap is necessary, striving to achieve a larger increase on a solid foundation!
<4> What specific fish, shrimp, and crabs should be associated with at each stage? Everyone should think for themselves; the circle will provide more detailed foolproof guidance (sector pairing, fish and shrimp pairing, association timing and positioning, cutting off timing and positioning, wave analysis charts, time and space comprehensive predictions, etc.)!
V. To forge iron, one must first be strong
As the leader of the Xiaobai Learning Sect, I am a practitioner of wave theory, Chan theory, Wyckoff trading method, and Gann theory, the creator of high win rate trading models, the pioneer of BBI+KC reversal channel lines, the originator of DC cycles, supplemented by CCI advanced trend lines, improved Fibonacci fan alignment speed resistance lines, and advanced reversal indicators, exploring the sustainable path to earn continuous profits!
To forge iron, one must first be strong; only by improving cognition can one successfully navigate through bull and bear markets. We emphasize the sharing of knowledge, cultivating independent thinking, learning and accumulating during bear markets, and making oneself someone else's dream during bull markets. We welcome those who agree with the values of the Xiaobai Learning Community, are willing to learn, and cultivate independent thinking; only when you transform this knowledge and skills into your own accumulation can you possess the ability to think independently and avoid becoming a fool!
💡 Note: Investing is like walking at night, always carry the 'risk awareness' lantern, stay away from trading fog, and refuse to blindly chase light.
Creating articles is not easy; reading an article takes only a few minutes, but writing an article takes several hours. If you agree with our community, please give a thumbs up and share below! Your support is my motivation for creation!

