I've seen too many beginners in the crypto space 'running naked' in the market with real money—staring blankly at a variety of indicator parameters, following so-called 'expert signals' to chase highs and cut losses, only to see their account balance decrease. In fact, they all overlook a core issue: the essence of trading is price competition, and the 'living dictionary' that records price competition is the K-line you see every day but may not truly understand.
If we compare trading in the crypto space to sailing, K-lines are your compass; if we compare it to a battlefield, K-lines are the military intelligence reports. You may not understand macroeconomics, you don't have to focus on the Federal Reserve speeches, and you can even set aside complex indicators like MACD and RSI, but K-lines must be ingrained in your trading instincts. Today, I will use the most straightforward way to break down the underlying logic of K-lines, transforming your understanding from 'seeing K-lines like reading a celestial book' to 'reading K-lines like reading a story.'
First Layer: Understand the 'surface language' of K-lines
Each K-line is secretly telling you three key pieces of information: the outcome of the bulls and bears, the volatility range, and the traces of competition. To understand it, first grasp these four core elements:
Color and Direction: Different platforms may have different color schemes, but the logic remains unchanged—if the closing price is higher than the opening price, it is a bullish candle (the bulls won a round), and if the closing price is lower than the opening price, it is a bearish candle (the bears are temporarily dominant). Don't be misled by color; remember that 'the closing price determines the outcome' is the core.
Four Price Passwords: The opening price is the starting point of the competition, the closing price is the result of the competition, the highest price is the 'high ground' the bulls once reached, and the lowest price is the 'low ground' the bears once hit. A single daily K-line is like a 24-hour battle: the opening price is the battlefield starting point, the high and low prices are the extreme areas contested by both sides, and the closing price is the 'judgment of victory or defeat' for that day.
Strength of the Body: The 'thick pillar' in the middle of the K-line is called the body, and the longer the body, the more apparent the advantage of one side on that day. For example, a long bullish candle body indicates that the bulls strongly pushed forward from opening to closing, with the bears having almost no counterattack capability; conversely, a long bearish candle body is proof of the bears unleashing all their firepower.
Shadow Mysteries: The 'small tails' above and below the body are called shadows, which are the 'subtext' of the K-line. A long upper shadow indicates that the bulls attempted to push higher but were pushed back by the bears; a long lower shadow indicates that after the bears pressed down, the bulls fought back vigorously. Those 'bald and barefoot' (without shadows) K-lines often represent one side completely controlling the situation, without giving the opponent any chance to counterattack.
Second Layer: The 'strong and weak password' behind K-lines
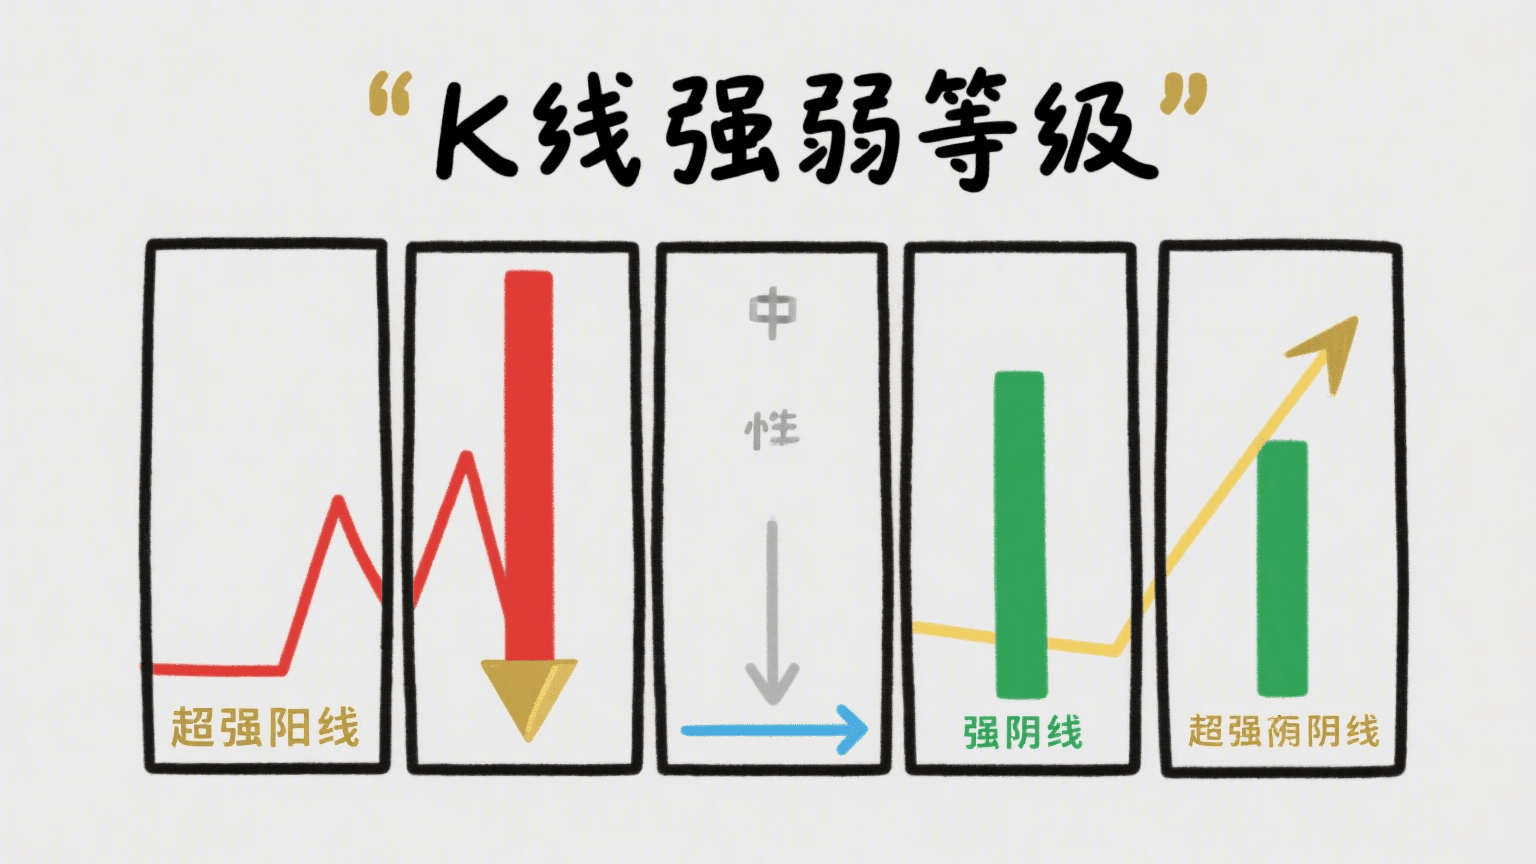
The shape of a single K-line conceals the 'strength ranking' of bullish and bearish power. Learning to distinguish these five levels of strength will allow you to quickly judge the current market's 'energy field':
Super Strong Bullish Candle: The body is thick like a pillar, with upper and lower shadows so short they are almost invisible. This is a signal of a 'full-scale attack' initiated by the bulls, with funds concentrating and prices rising dramatically, making it highly likely for a follow-up surge. When encountering this K-line, don't be in a hurry to exit, but be wary of 'the end of a strong bow'—if two super strong bullish candles appear consecutively, it may signal a pullback.
Strong Bullish Candle: The body length is considerable, with upper and lower shadows relatively short but clearly present. This indicates that the bulls hold an advantage, but the bears are launching sporadic counterattacks. This K-line is often seen during a trend continuation phase, where upward momentum persists but is not as aggressive as a super strong bullish candle. At this time, holding shares is advisable, but setting a take-profit level is necessary to avoid giving back profits.
Neutral Candle: The body is as small as a 'thin line', with upper and lower shadow lengths roughly equal. This is a signal of a 'ceasefire negotiation' between bulls and bears, indicating that the market temporarily lacks direction and may be brewing a trend reversal. When seeing this K-line, don't act impulsively; wait and observe the subsequent trend before taking action when a clear directional signal emerges.
Strong Bearish Candle: The body is relatively long, with upper and lower shadows short. The bear's power is clearly dominant, and the price is continuously suppressed throughout the day, often accompanied by panic selling. This K-line appears at high levels and may indicate a 'top signal'; if it appears at low levels, caution should be exercised as the bears may continue to press down.
Super Strong Bearish Candle: The body is long and steep, with upper and lower shadows almost disappearing. This is an extreme manifestation of the bears 'going for the kill', and the market may plunge into panic due to sudden bad news or large sell-offs, with prices plummeting. When facing this K-line, do not harbor any illusions; first control risks before discussing next steps, as beginners are most likely to 'bottom fish' at this moment.
Third Layer: Master the four 'reversal warning' patterns
A single K-line is a 'snapshot', while a combination of K-lines is the 'plot direction'. Once these four classic patterns appear, they often signify that the market may be undergoing a 'change of dynasty':
Doji Star: The opening and closing prices are almost identical, with the body resembling a thin line, but the upper and lower shadows are not short. This is a 'hesitation signal' in the market—bulls and bears are at a standstill, with neither side gaining absolute advantage. If a doji star appears after a continuous rise, be cautious of 'bull exhaustion'; if it appears after a continuous decline, it may indicate 'bear exhaustion', signaling an approaching reversal.
Hammer Candle: The body is very small (can be bullish or bearish), with a lower shadow more than twice the length of the body, and almost no upper shadow. This K-line resembles a 'hammer nailed to the bottom' and is often seen at the end of a downtrend. Its appearance indicates that after the bears pressed down, the bulls began to secretly bottom fish, pulling the price back up forcefully, with a high probability of follow-up rebounds, but it is essential to confirm the subsequent bullish candles 'passing the baton' for it to be considered safe.
Inverted Hammer Candle: The exact opposite of the hammer candle, with a small body, a long upper shadow, and a very short lower shadow. This is more like a 'signal flare of failed bullish attempts', often appearing at the end of an uptrend. It seems the bulls are trying to push up, but they are forcefully pushed back by the bears, indicating heavy selling pressure above, making a 'shift from rising to falling' very likely.
Engulfing Pattern: Composed of two K-lines, where the body of the second completely 'engulfs' the body of the first (bullish engulfing or bearish engulfing). Bullish engulfing is a declaration of the bulls 'turning the tide'—the day before, the bears were still pressing down, and the next day the bulls directly counterattack strongly, pulling the price up to a higher level; bearish engulfing indicates the bears 'striking back from desperation', often signaling an imminent trend reversal. When seeing this pattern, decisively adjust your position.
Finally, let me say something straightforward
K-lines are not 'fortune-telling artifacts', but they are the market's most honest 'emotional recorders'. Those who stare at various fancy indicators every day would be better off spending 3 days thoroughly understanding the underlying logic of K-lines—understanding what their colors represent, what the length of the body indicates, and what the shadows and patterns suggest.
The core of making money in trading has never been about finding 'sure-win signals', but about understanding the changes in bullish and bearish power through K-lines, following the rhythm when the bulls are dominant, and avoiding risks in a strong bearish market. I will continue to break down the pairing techniques of K-lines with trading volume and time cycles, teaching you how to capture trend turning points with K-lines.
Follow me, and tomorrow I will help you unlock the golden combination of 'K-lines + trading volume', so that your trading no longer relies on guessing! Understanding K-lines is the real confidence on the trading path; let's slowly become rich together~

