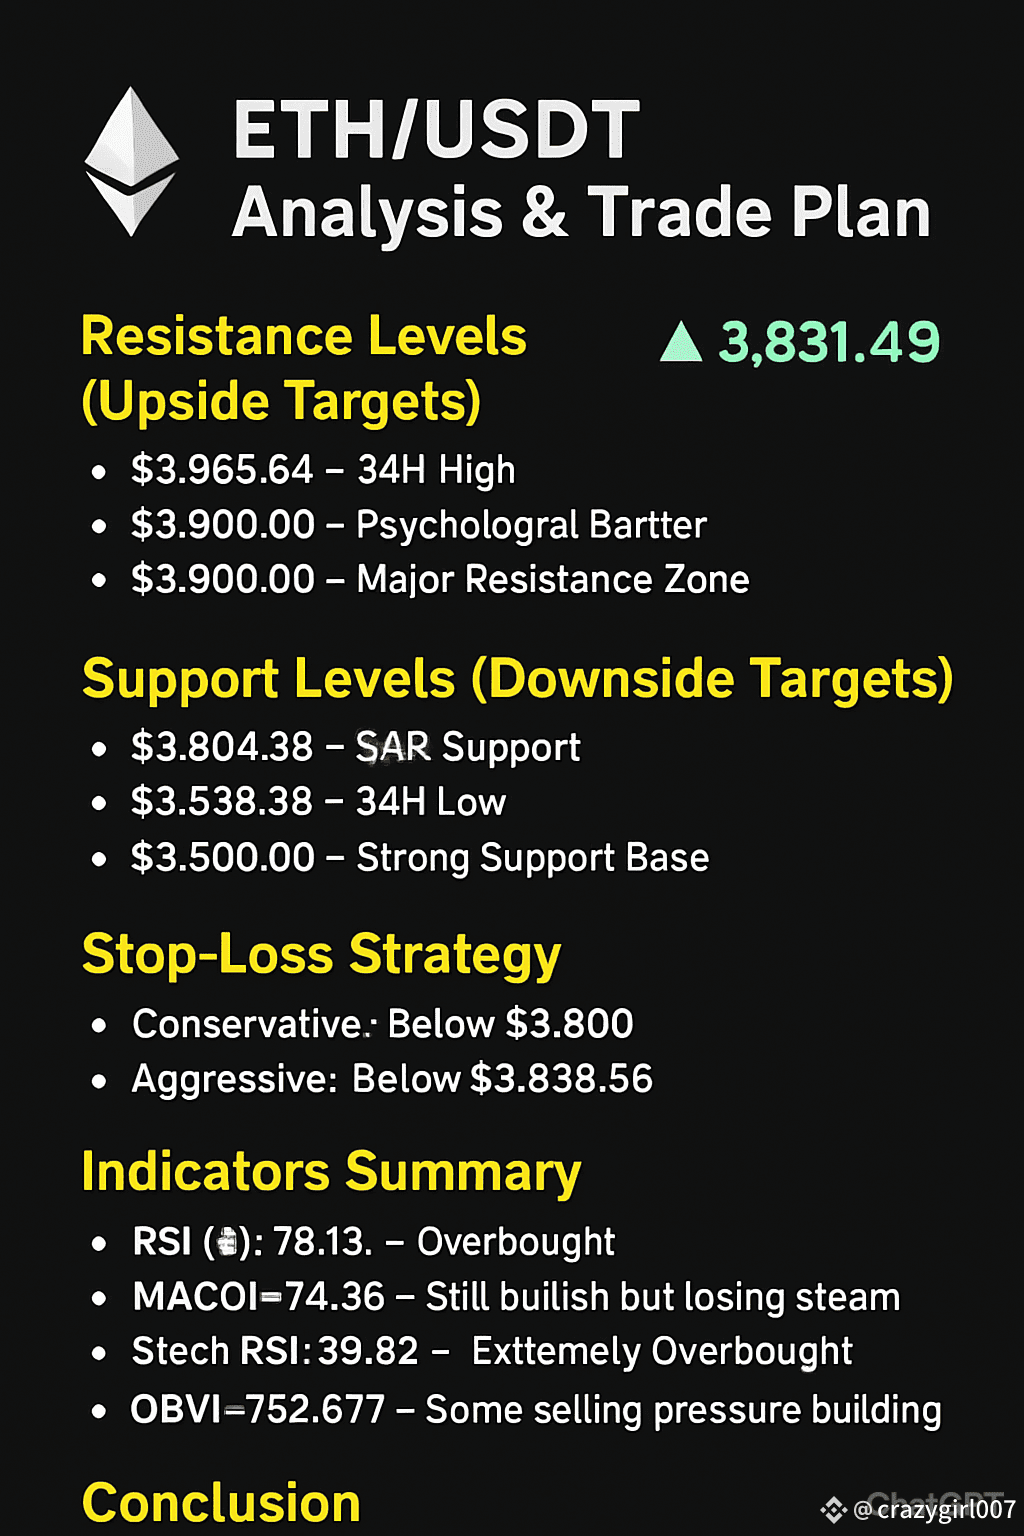
🟢 Price Snapshot: $3,831.49
Here's what I'm seeing on the chart 👇
🔼 Resistance Levels (Upside Targets):
1. $3,865.64 – 24H High
2. $3,900.00 – Psychological Barrier
3. $4,000.00 – Major Resistance Zone
🔽 Support Levels (Downside Targets):
1. $3,604.39 – SAR Support
2. $3,638.56 – 24H Low
3. $3,500.00 – Strong Support Base
📉 Stop-Loss Strategy:
Conservative: Below $3,600
Aggressive: Below $3,638.56
📊 Indicators Summary:
RSI (6): 79.13 → Overbought 🔺
MACD: +24.36 → Still bullish, but losing steam
Stoch RSI: 98.82 → Extremely Overbought ⚠️
OBV: -782,677 → Some selling pressure building
📈 Conclusion:
ETH is riding a bullish wave, but momentum indicators suggest a short-term pullback to the $3,604–$3,638 zone before the next leg up. A confirmed break above $3,865 could send ETH towards $3,900–$4,000.
🧠 My Trade Plan:
Long Entry: $3,604–$3,638
🎯 TP: $3,865–$4,000
🛡️ SL: Below $3,600
Short Entry: On rejection at $3,865
🎯 TP: $3,638
🛡️ SL: Above $3,900
🧠 Stay sharp. Trade smart. Use proper risk management.
#ETH #CryptoTrading #TechnicalAnalysis #BinanceSquare #ETHUSDT

