This ETH/USDT 2-hour chart displays a classic bull flag pattern, suggesting continuation of the upward trend. The Bollinger Bands show expanding volatility, while volume bars confirm increasing buying interest. Support and resistance zones are clearly marked with colored rectangles. Based on this technical setup, traders might consider entering at 3594.71, with first take profit at 3701.19, second at 3751.63, and third target at 3916.95. A stop loss at 3471.41 would help manage downside risk. The overall pattern indicates potential for further price appreciation, with the bull flag typically signaling a brief consolidation before the next leg up.
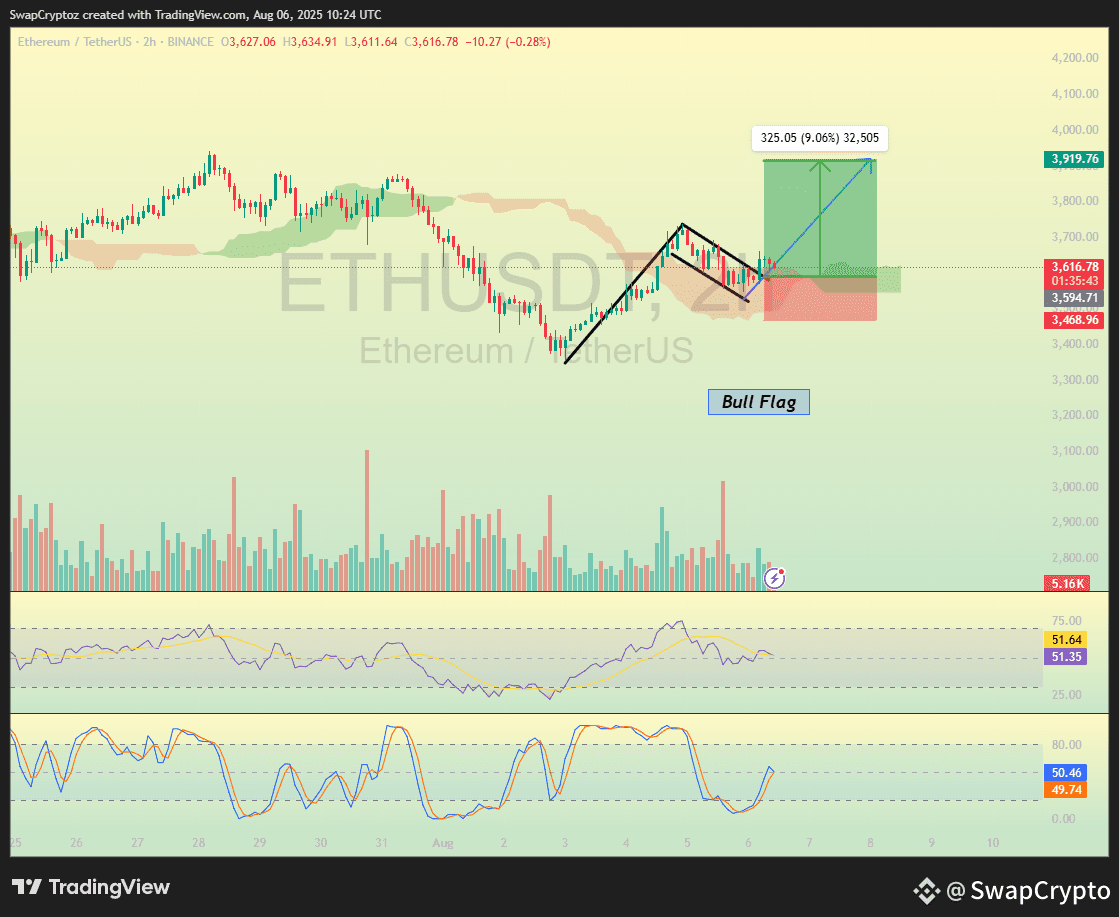
The ETH chart shows a bull flag pattern with Bollinger Bands indicating volatility, volume bars confirming activity, and colored rectangles marking support/resistance zones for potential price movement.
✨ ENTRY: $3594.71
🎯 TP1: $3701.19
🎯 TP2: $3751.63
🎯 TP3: $3916.95
🛑 STOP LOSS: $3471.41
For more details, check out my bio by clicking on my profile.
This signal is for spot trading only. If you're interested in future signals, join my live Binance session.
Simply click on my profile to join!
#swapcryptoz #ETH #ETHUSDT