On my journey in cryptocurrency trading, I started as a small retail trader with 6000 yuan and finally reversed my fate to become a middle-class with 50 million!
Today, I will share the insights I have gained along the way.
The most important point in cryptocurrency trading is money management. Don't invest all your money at once. I usually divide my funds into five parts, using only one part for trading each time. That way, even if I incur losses, I won't be overly stressed. Additionally, I set a rule for myself: if I lose 10%, I immediately withdraw, regardless of market conditions. If I lose 10% five times in a row, I've only lost 50%, but if I gain, the returns can be much more. Even if I find myself stuck in a position, I can maintain my mindset.
In the crypto space, many friends may not know how to read indicators and trading strategies, and even those who do understand are few and far between. There's a saying, 'One good trick can feed you forever.' Mastering a technique that you can comprehend is not difficult; the challenge lies in not wanting to learn and being unwilling to study. Trading cryptocurrencies is not for others, but for yourself. If you're willing to put in the effort to master it, trading cryptocurrencies won't be as hard as you think.
In addition to solid techniques, I also strictly adhere to the following 8 iron rules:
1. After a stop loss, don't rush to retaliate! Stop trading after consecutive stop losses.
When I first started trading contracts, I often made the mistake of 'trying to recover immediately after a stop loss.' Once, while shorting Bitcoin, I faced two consecutive stop losses and lost $800. In a fit of determination, I thought, 'The third time will definitely be right,' added leverage, and opened a large position, which resulted in immediate liquidation, losing even my capital.
Later, I found out from the data that 78% of liquidation cases occurred during impulsive trades following consecutive stop losses.
Now I have established a 'double stop-loss circuit breaker mechanism': if I experience two consecutive stop losses, I immediately turn off the trading software and spend half an hour reviewing—did I misjudge the trend? Or did I set the stop loss incorrectly? If I can't find the problem, I will go flat for a day. The market is never short of opportunities; without capital, even if opportunities arise, they have nothing to do with you. Remember: stop loss is about controlling risk, not 'failure.' Rushing to retaliate will only increase your losses.
2. Don't believe in 'get-rich-quick' nonsense! Always keep your position below 10%.
Statistics from a certain contract platform sent chills down my spine: 92% of users who make a single full-position trade will see their assets reach zero within three months. Newbies often treat contracts as 'ATM machines,' believing 'going all-in will make them rich,' but leverage is a double-edged sword; with 10x leverage, a 5% fluctuation can lead to liquidation.
I've seen the most tragic case: a brother went all-in on a meme coin with $50,000. When it rose 5%, he got overly excited, and when it dropped 5%, he panicked and held the position. Within half an hour, he faced liquidation, and his $50,000 was reduced to less than $1,000. Now I strictly control my positions: I never open a position exceeding 5%-10% of my capital with $50,000, at most $5,000. Even if I miss out on 10 market movements, as long as I can avoid one liquidation, I've already outperformed most people. Trading contracts is a marathon, not a sprint; you must endure to survive.
3. Trading against the trend = going against money! Never force it in a one-sided market.
Last week, Bitcoin's 4-hour chart plummeted by 15%. Someone in the community shouted, 'It's bottomed out,' and went all-in on the long side, resulting in three liquidations within three hours, lamenting, 'The market is unreasonable.' But is the market really unreasonable? In a one-sided market, going against the trend is like a mantis trying to stop a car.
There is a golden rule for judging one-sided markets: look at the 1-hour candlestick chart. If there are five consecutive bullish (or bearish) candlesticks, and the moving averages are diverging (the short-term moving average sharply separating from the long-term moving average), this indicates a strong trend signal. At this point, do not think about 'buying the dip' or 'shorting a rebound'; the right course of action is to follow the trend or stay flat. Last year, Ethereum rose from $1800 to $4000; following the principle of 'not going against the trend,' I only went long and never shorted, even during the retracements, and I steadily made a threefold profit.
4. If the risk-reward ratio is less than 2:1, don't open a position! Don't be a fool who 'earns small and loses big.'
The Achilles' heel of countless retail traders: they hastily take profits after earning $1000 but endure a loss of $2000 before finally cutting their losses. Over the long term, they 'earn not enough to offset their losses.'
The scientific trading logic is: before opening a position, you must set at least a 2:1 risk-reward ratio—for example, if the stop loss is set at $500, the take profit must be set at least at $1000. If this standard isn't met, don't touch it.
I set a rule for myself: before opening the trading software, I first calculate 'how much to stop loss, how much to take profit.' If the risk-reward ratio is 1:1.5? I discard it immediately without hesitation. Last year, when trading SOL contracts, I initially wanted to go long at $100, calculated a stop loss at $95 (loss of $500) and a take profit at $105 (profit of $500), with a risk-reward ratio of 1:1, and decisively gave up. Later, when it retraced to $90, I set a stop loss at $85 (loss of $500) and a take profit at $100 (profit of $1500), with a risk-reward ratio of 3:1, and entered the market, making a steady profit of $1500. Remember: trading is not about 'making the right calls often,' but 'earning more when right and losing less when wrong.'
5. Frequent trading = working for the exchange! Professionals wait for the right moment.
Data from a leading exchange is chilling: ordinary users trade an average of 6.3 times a day, while the top 10% of profitable traders only trade 2.8 times a week. When I first started trading contracts, I also loved 'making my presence known,' opening 10 orders a day, paying a lot in fees while my capital dwindled. Later, I learned: frequent trading not only costs money but also drains your mindset.
The market fluctuates every day, but 90% of the fluctuations are 'ineffective noise.' Professionals wait for 'high-certainty opportunities'—such as trend breaks, key support and resistance level resonances. Now, I only check the market twice a day (half an hour after opening and half an hour before closing); during other times, I do what I need to do. Last year, there was a time when Bitcoin consolidated for 10 days; I didn't open a single position, watching others lose back and forth during the consolidation. I only entered after the breakout, making more profit from one trade than most did in ten. Remember: missing opportunities is not regrettable; blindly entering is truly frightening.
6. You can't earn money outside of your understanding! Only trade cryptocurrencies you fully understand.
When Dogecoin surged 300% due to a tweet from Musk, someone in the group followed the trend and ended up buying at the peak; when the price plummeted, they faced liquidation. Their loss was not due to luck but a lack of understanding—how can they expect to make money without even understanding Dogecoin's market cap and chip distribution?
The core principle of contract trading: only trade cryptocurrencies you fully understand. I currently only trade 3 cryptocurrencies: Bitcoin, Ethereum, and SOL, each of which I've thoroughly studied in terms of volatility patterns, major player habits, and key levels. No matter how much an unfamiliar cryptocurrency rises, I won't touch it because I know: money made by luck in the short term will eventually be lost through strength. By staying within my competence, I can avoid the deadly trap of 'trading by feeling.'
7. Holding onto a losing position is like walking into an abyss! Acknowledge your mistakes; as long as you're alive, there will be opportunities.
The cruel truth of the leveraged market: holding onto positions equals betting your capital on luck. With 10x leverage, price fluctuations are magnified tenfold; a 5% floating loss in a holding position can lead to liquidation. Data from a certain contract community shows that users who consecutively hold positions three times have a liquidation probability as high as 91%.
I have seen the most stubborn brother: he went long on Ethereum, set a stop loss at $3000, and when it dropped to $2900, he thought, 'It will rebound,' so he removed the stop loss and held the position, resulting in a drop to $2500 and liquidation, losing $200,000. Now I must set stop losses when opening positions; when the time is up, I cut it—no 'waiting a bit longer.'
Acknowledging mistakes is better; a 5% stop loss is always better than a 100% liquidation— as long as you are alive, you can earn back the next trade.
8. After making profits, don't get carried away! Withdraw half of your capital, and treat the rest as 'game money.'
Human weaknesses are most easily exposed when making profits: when they make money, they open random positions and increase leverage, resulting in profit reversal and further losses. I have suffered this loss before: once I made $50,000, feeling 'like a god,' I went all-in on a meme coin contract, and within three days, I lost all my profits and $20,000 of capital.
Now I have a strict rule: every time I profit, I immediately withdraw 50% of my capital. For example, if I earn $10,000, I first transfer $5,000 to my bank card, leaving the remaining $5,000 as 'game money,' so I won't be upset even if I lose. This way, I can lock in profits while maintaining clarity—you'll find that trading with 'profits' keeps your mindset steady, and you won't act erratically due to 'fear of losing capital.'
Finally, I want to say: contracts are not gambling; they are 'probability games with controllable risks.' The core of these 8 iron rules is to use rules to manage human weaknesses.
Stop loss, position control, follow the trend, wait for opportunities, avoid holding positions, adhere to understanding, withdraw profits... If you do these well, you've already avoided 90% of the loss traps.
Remember: the winners in the contract market are not the ones who predict market movements most accurately but those who control risks best. Losing less is earning; staying alive allows you to wait for the real opportunity. May you follow these 8 iron rules to walk steadily and profitably in the contract market.
So how can one excel in cryptocurrency trading? Once a person enters the financial market, it's hard to turn back. If you're currently at a loss but still confused, planning to treat cryptocurrency trading as a second career, you must understand 'Bollinger Bands + indicator techniques.' Comprehending and mastering them can help you avoid many pitfalls; these are personal experiences and feelings, so I recommend saving and revisiting them repeatedly!
Indicator Introduction
1. The principle of Bollinger Bands
Bollinger Bands were created by the renowned analyst John Bollinger.
Its principle is rooted in the normal distribution theory in statistics.
Although the short-term fluctuations of financial asset prices may seem random,
However, over the long term, it will exhibit regular fluctuations around a central value (mean).
This characteristic highly matches the feature of data being dispersed around the mean in a normal distribution.
1. Core statistical basis.
In the normal distribution curve,
About 68% of data falls within the mean ± 1 standard deviation range.
About 95% of data falls within the mean ± 2 standard deviations.
About 99.7% of data falls within the mean ± 3 standard deviations.
Bollinger Bands leverage this characteristic by viewing price volatility as 'random variables conforming to a normal distribution,' calculating the mean and standard deviation of the price series to dynamically construct reasonable volatility boundaries.
Values and standard deviations dynamically construct reasonable price volatility boundaries.
John Bollinger discovered through extensive backtesting that
The moving average calculated over a 20-day period serves as the mean (middle band), adding and subtracting ±2 standard deviations to form the upper and lower bands.
It captures the normal volatility range of prices most accurately.
About 95% of price data will fall within this range.
The portion beyond the range can be regarded as 'abnormal volatility.'
This is also the core logic of using Bollinger Bands to judge overbought and oversold.
2. The underlying logic of dynamic adjustment.
Price volatility exhibits 'clustering.'
When the market is calm, the volatility is small (small standard deviation), and the bands narrow.
when the market undergoes drastic changes, the magnitude of fluctuations is large (large standard deviation), and the bands expand.
This self-adjusting feature allows Bollinger Bands to adapt to 'narrow volatility' during sideways consolidation.
They can also respond to 'wide volatility' in trending markets.
It avoids the failure issue of fixed-range indicators in extreme market conditions.
2. The composition of Bollinger Bands.
Bollinger Bands are mainly composed of three bands: the upper band, the middle band, and the lower band.
Middle band: usually a moving average line, most commonly the 20-day moving average. It reflects the mid-term trend of the price, and prices generally fluctuate above and below the middle band.
Upper band: calculated by adding two standard deviations to the middle band. It represents the price resistance level; when the price rises near the upper band, it may encounter resistance.
Lower band: calculated by subtracting two standard deviations from the middle band. It represents the price support level; when the price drops near the lower band, it may find support.
These three bands form an area similar to a channel, where prices mostly operate within this channel.
3. The core usage of Bollinger Bands
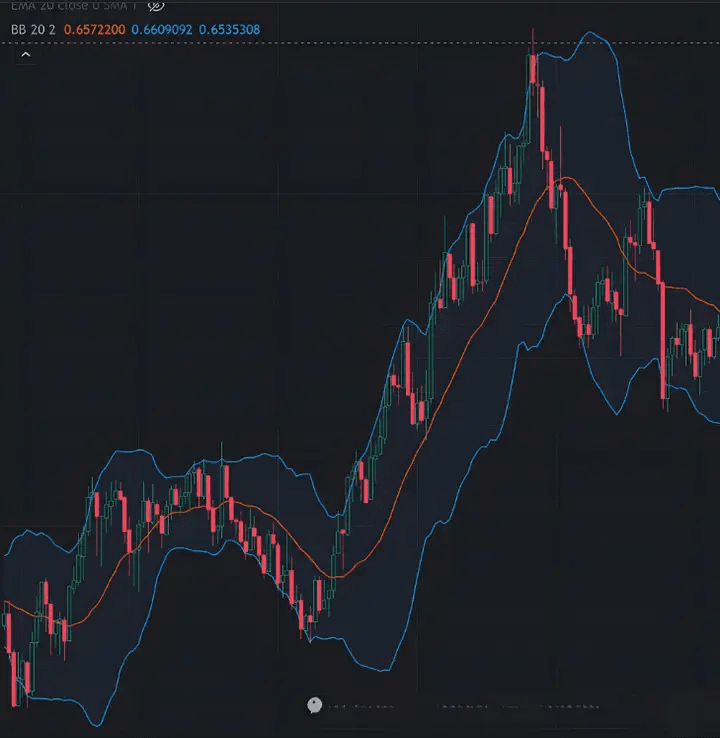
Stock prices operate within the bands: when prices fluctuate between the upper and lower bands of the Bollinger Bands,
And when the middle band shows a certain trend, it indicates that the price is in a normal volatility state.
If the price runs up along the middle band and fluctuates between the middle band and the upper band,
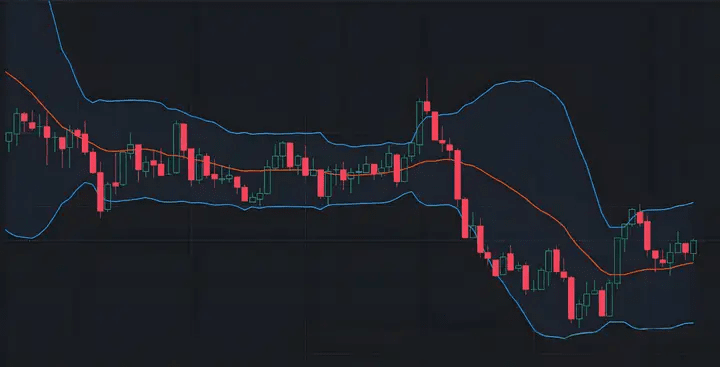
Usually indicates an upward trend; if the price runs down along the middle band,
And if it fluctuates between the middle band and the lower band, it may be in a downward trend.
Price breaks the bands: when the price breaks above the upper band, it may indicate that the market is overbought, and a price correction may follow; when the price breaks below the lower band, it may indicate that the market is oversold, and a price rebound may follow.
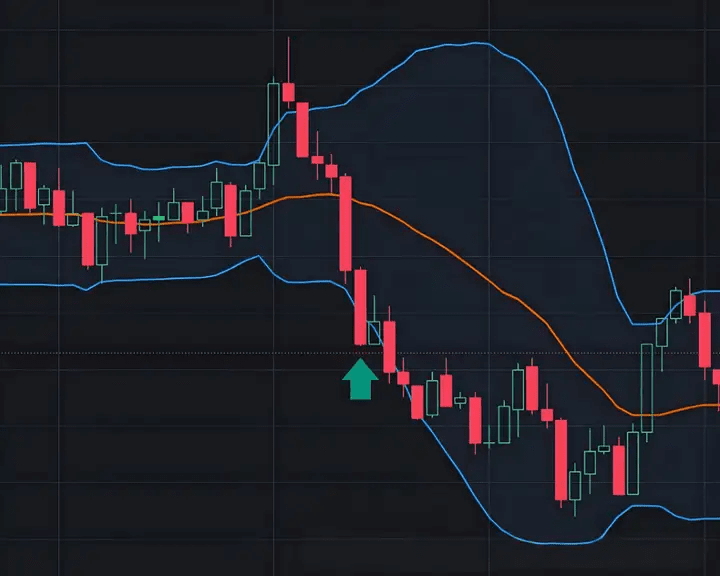
As shown in the figure, buying when it breaks down will only lead to more losses.
However, it is essential to note that a breakout does not necessarily mean a trend reversal; sometimes, it may signal an acceleration of the trend, requiring comprehensive judgment in conjunction with other indicators.
Band contraction and expansion:
When the Bollinger Bands' bands contract, it indicates that the price volatility is decreasing, and the market is in a consolidation phase, which may lead to significant fluctuations later.
When the bands expand, it indicates that the price volatility is increasing, and the market trend may be strengthening.
4. Applicable angles of Bollinger Bands and applicable markets:
Bollinger Bands are applicable to various financial markets such as stocks, futures, and forex, as the prices in these markets exhibit certain volatility patterns that can be analyzed using Bollinger Bands.
Applicable cycles: whether for short-term intraday trading, mid-term swing trading, or long-term trend judgment, Bollinger Bands can be effective.
However, in different cycles, the parameters of Bollinger Bands may need to be adjusted appropriately.
Limitations: Although Bollinger Bands are very practical, they also have certain limitations.
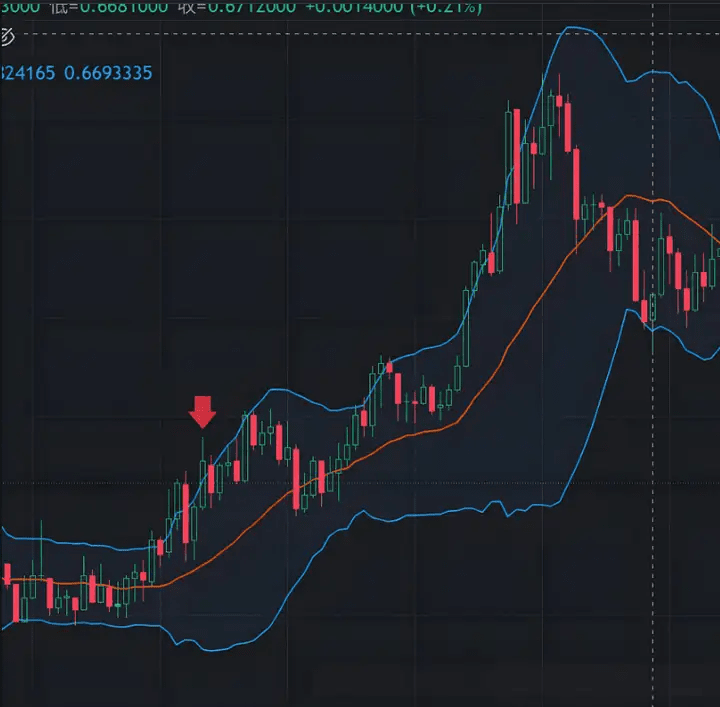
Breaking above does not necessarily mean the price will correct.
It cannot serve as the sole basis for trading decisions; it needs to be used in conjunction with other indicators like trading volume and MACD to improve judgment accuracy.
Moreover, in extreme market conditions, prices may remain outside the Bollinger Bands for extended periods, during which the reference significance of the Bollinger Bands will diminish.
To summarize: Bollinger Bands are a simple and effective technical indicator. Mastering its principles, components, core usage, and applicable angles can provide strong support for our investment decisions.
The above are the most practically significant Bollinger Band strategies; these techniques can be applied in different markets, different varieties, and different cycles, suitable for most traders to learn and use.
Don't get lost again. If you want to steadily flip, want a surge, or want a comeback, follow my strategy!
I set the rhythm, choose the cryptocurrencies, determine the direction, and provide 2-5 strong signal trades every day with precise tips!
Stop relying on feelings to trade; we rely on discipline and strategy to deliver results!


