Theoretically, ordinary people can change their fate through the cryptocurrency market. The average annualized return on cryptocurrency trading exceeds 10%, and long-term investment in the cryptocurrency market, based on the compounding effect, can potentially lead to wealth.
I believe that freedom = ability - desire. Even someone with average ability but very low desire can still feel happiness.
Ordinary people can indeed change their fate through cryptocurrency trading, but it is certainly a very small number, not the majority.
Let me talk about myself! I've been trading cryptocurrencies for over ten years, going from liquidation to achieving financial freedom, supporting my family through trading. By 2024, my funds have multiplied by 50 times; if not for two withdrawals for house purchases, it would have been 85 times.
In addition to solid techniques, I strictly adhere to the following six iron rules of trading:
Survival rules for small funds: Catching one wave a day is enough; reject all-in! (Applicable for principal <100K) *Don't be a high-frequency trading god! Trading more than 3 times a day will surely break your mindset! *Position ≤ 50%! Leave enough bullets for emergency purchases; don’t gamble everything at once! *Real case: During a certain ETH plunge, I shorted with 5% position and made considerable profits within 3 hours (exact multiples not hyped, those who understand will know). Good news landing = warning for bad news! Running fast is an art! *If you didn't run on the day of major policy/project announcements, the next day’s high opening is your last escape route! *Beware! 'Good news' often turns into a scythe; don't stand at the top and become chives!
News + holidays = advance layout from a god's perspective! *Check the calendar before trading cryptocurrencies! Every month, on the day of the U.S. CPI data (around the 10th), inevitably reduce positions to avoid risks! *48 hours before major holidays in China/US! Clear contracts to ensure safety! Don't be stubborn! *Blood and tears lesson: Referencing the day of a certain year's crash, the fully invested party directly evaporated 90%...
Short-term core: Quick, accurate, and ruthless + learn to stay out of the market! *Best hitting area: 15-minute candlestick + KDJ golden cross! (Essential for technical traders) *Harvesting against human nature: RSI > 70 consider short, <30 consider long (going with the trend is very important!) *In a sideways market? Shut down! Stay out! Being cautious is not shameful!
Daily average fluctuation <2%? Safety is paramount!
5. Cut losses! Cut losses! Cut losses! Dignity is more important than money! *If the direction is wrong, cut immediately! Hesitating for a second could mean a 10% loss! *Fixed stop-loss method: 3% of the principal is the red line! Hit the line and cut! *Dynamic stop-loss method: After floating profits of 50%, decisively run after a 20% pullback! Preserve profits! *Blood history: Once held onto a cryptocurrency long position for too long, lost half a year's profits in 3 days... a lesson learned!
The short-term technical trader's bible: 15-minute chart + KDJ! *The microscope for short-term traders! Focus on this! *KDJ golden cross + volume breakthrough = a signal worth trying! *MACD top divergence + shrinking volume = run! Danger signal! Lastly, let me say something from the heart: contracts dance on the knife’s edge; 99% of people lose money for a reason!
These six rules are my lifelines earned with real money. Don't fantasize about getting rich overnight! Strictly enforce discipline, control your position, and respect the market! I share this to help those with fate avoid pitfalls, not to encourage mindless rushing!
Welcome everyone to my knowledge sharing series. The purpose of this series is to gradually guide everyone in learning and judging various situations in the market.
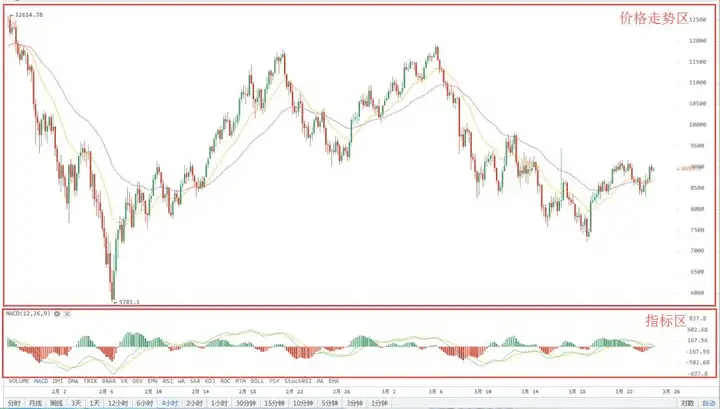
The outline of knowledge sharing can be summarized as follows: starting from the bottom indicator area, then leading everyone to understand the candlestick chart in the price movement area, while interspersing some macro concepts such as Dow Theory and Elliott Wave Principle.
Looking at the entire analysis chart, it is mainly divided into the price movement area and the indicator area. We will gradually lay the groundwork; the main content of the first session is the MACD indicator+.
The MACD indicator, also known as the Exponential Moving Average Convergence Divergence, is developed from the double exponential moving average. Simply put, it reflects the aggregation and separation between short-term and long-term moving averages, indicating the current bullish or bearish state and potential price trend changes. It's easier to read, and we often mention MACD in Xiaofang's essays.
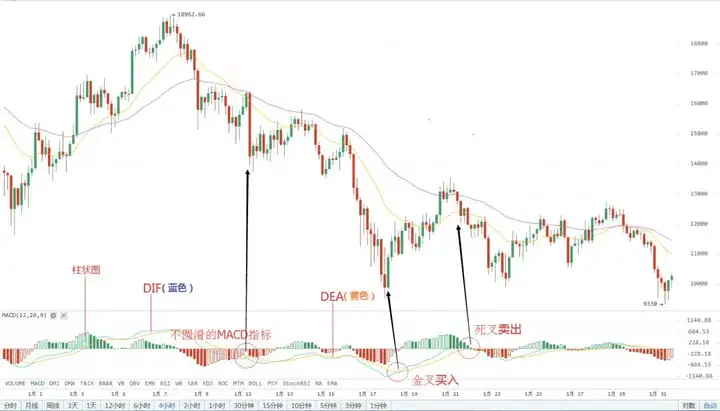
The MACD consists of the blue line DIF, the yellow line DEA, and the histogram. The zero axis serves as the central axis, with above O indicating strength and below O indicating weakness. A blue line crossing above the yellow line is a golden cross, while crossing below is a death cross.
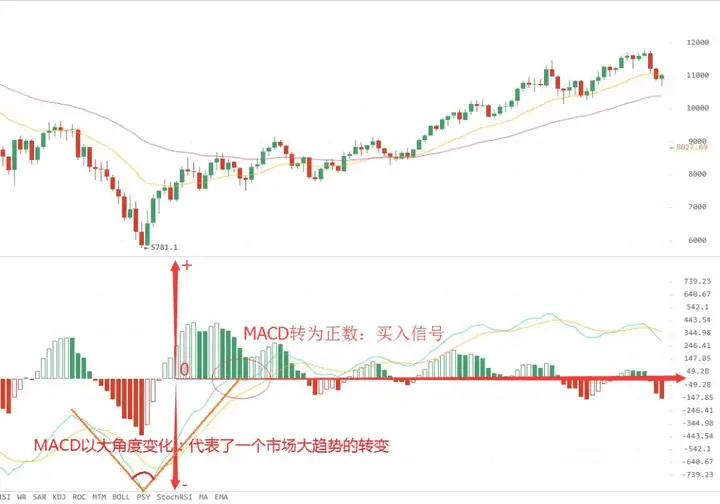
1. Theoretically, when the MACD turns from negative to positive, it is a buy signal. When the MACD turns from positive to negative, it is a sell signal. A significant angle change in the MACD indicates that the gap between the two moving averages is rapidly widening, representing a major trend shift in the market.
2. In practical operation, MACD serves two main functions: one is to determine the trend, and the second is to judge pullbacks or reversals through divergence.
1. Buy at golden crosses, sell at death crosses.
Simply put, this means chasing highs and cutting losses. In a bullish market, buy at golden crosses; in a bearish market, sell at death crosses. However, in actual operations, one often needs to anticipate golden and death crosses, but the manipulators certainly don't make it easy for you to analyze trends. One must combine other indicators for further actions.
2. Sell at top divergence, buy at bottom divergence.
Under normal circumstances, the MACD indicator should move in tandem with stock prices. However, due to certain factors, there are times when the indicator fails to synchronize with the price, resulting in what is commonly referred to as divergence. Simply put, divergence occurs when there is a differing trend between the price and the indicator.
Mainly divided into two types:
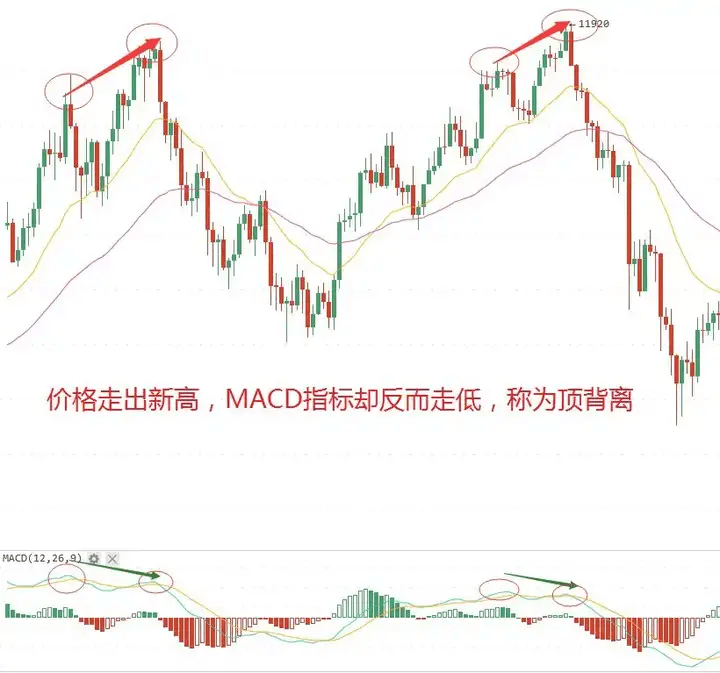
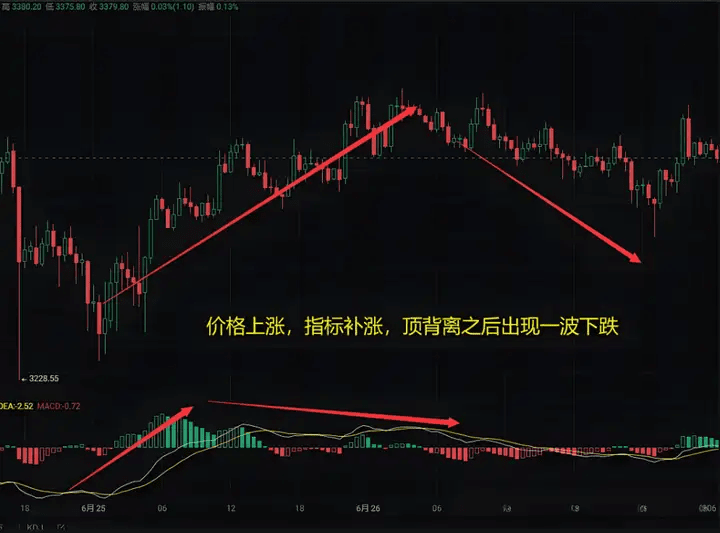
(1) Top divergence: Price hits a new high while the MACD indicator declines.
(2) Bottom divergence: Price declines while the MACD indicator rises.
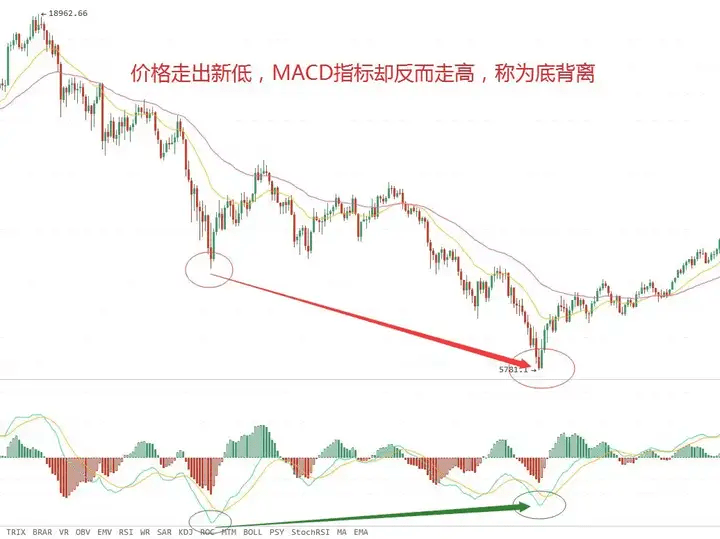
In practice, it is often summarized as topping out and bottoming out: sell at top divergence, buy at bottom divergence. In a rising market, prices continuously set new highs, and the moving averages appear perfectly bullish. If one only looks at the price and moving averages, it might seem that the rally has not yet ended. However, after several waves in the market, some changes seem to occur; MACD top divergence often reminds everyone that such trends can end at any moment.
MACD is a commonly used technical indicator. Basically, when you open the trading interface of any financial product, the first sub-chart is usually MACD. The fact that so many people use it indicates that it is genuinely useful. Furthermore, the more people use it, the more it feeds back into the market; when everyone sees this signal, they will act based on it, and their actions will create feedback in the market, truly driving market fluctuations. Therefore, regardless of whether you are a technical trader or not, you must have a detailed understanding of MACD.
The basic usage of MACD can be found widely, and I won't reiterate it here. However, you also notice that those textbook-style teachings seem like truths when viewed but fail to make money in practice. This is because those who write books are often market rejects who couldn’t make money in the market and turned to writing instead. Here, I will share some truly practical uses.
Advantages and disadvantages of MACD
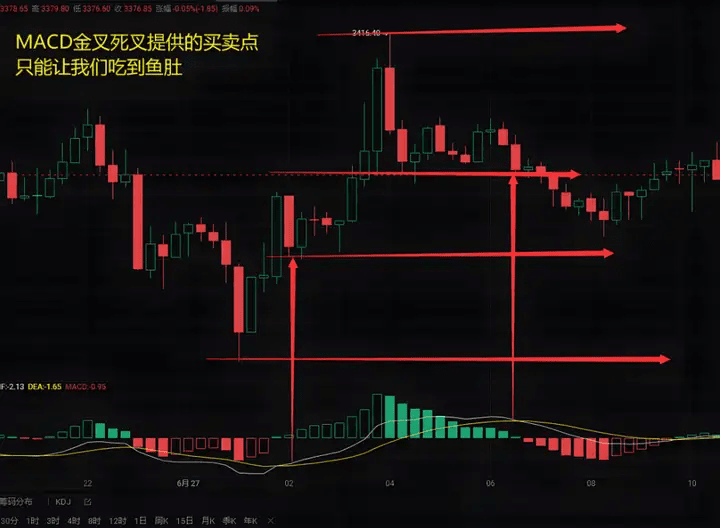
To understand an indicator, one must first know its advantages and disadvantages, when it cannot be used, when it is not effective, when it is invalid, and when it works best. The MACD is a trend indicator with a high accuracy rate, but it also has a significant drawback: it is severely lagging.
With high accuracy, we can use it as a trend indicator, and its accuracy is even higher over longer periods, only making mistakes during market transitions. The severe lagging drawback indicates that it is difficult for us to find perfect buy and sell points within this indicator. If using MACD to find buy and sell points, it is important to clarify that we only go for the belly of the fish, or even just a part of the belly; only by clarifying this point can we use MACD to find buy and sell points.
Zero Axis
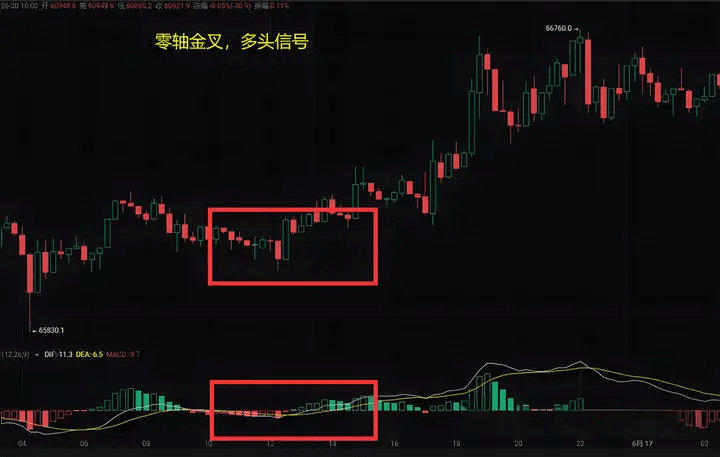
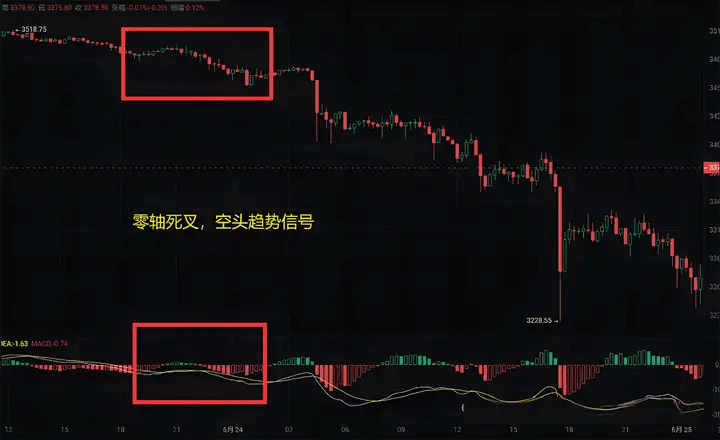
The zero axis of the MACD can be viewed as the boundary line between bullish and bearish trends. Below the zero axis indicates a bearish trend where bullish signals should be avoided; even if one enters, it should be light and quick in and out. Bearish signals can be held for a trend. The opposite is true above the zero axis. Golden cross and death cross signals formed near the zero axis are referred to as zero-axis golden cross and zero-axis death cross, which are more effective bullish and bearish signals.
Divergence
Divergence is a relatively practical form of MACD. Normally, price and indicator move in proportion; when price and indicator continuously move in opposite directions, it indicates divergence. When things are abnormal, something strange occurs; if the price rises while the indicator falls, it indicates that this rise is problematic, and the same goes for bottom divergence.
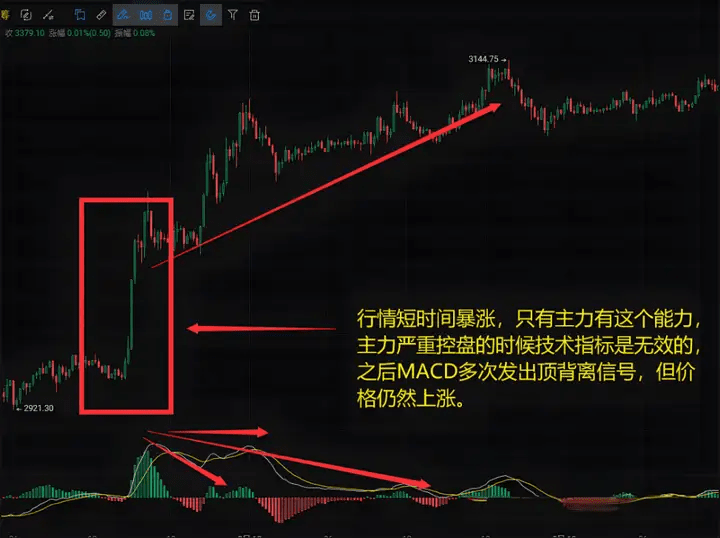
It should be pointed out that in the cryptocurrency market, occasional small probability one-sided trends occur. During these times, divergence becomes ineffective. This can be easily eliminated by observing strength; when the upward or downward force is very strong, a significant increase or decrease within a very short time indicates that the major forces are controlling the market. At this point, technical indicators become ineffective, and divergence, no matter how accurate, will continue to diverge.
Technical indicators are the tools we use to observe the market. Since everyone is looking at them, they must be useful. Even if they are not useful, because we investors look at them, they will change to be useful because the market is determined by the behaviors of countless investors. However, one should be aware that many times technical indicators are ineffective or not useful. Every technical indicator has its shortcomings; the more useful the indicator, the more apparent its drawbacks. To learn how to use a technical indicator, one must first understand its shortcomings and leverage its strengths to bring about stable returns.
In conclusion, the role of the MACD indicator is significant, but because trends are often subject to deliberate manipulation, novices can easily be misled. I emphasize once more that we need to combine other indicators for further actions. To talk further, we must take a macro perspective and never focus solely on one indicator; this is something everyone must keep in mind.
Don't get lost anymore; if you want to stabilize, experience explosive growth, or make a comeback, follow my strategy!
I lead the rhythm, select the coins, and set the direction, providing 2-5 strong signals daily with precise indications!
Stop relying on intuition for trading; we rely on discipline and strategy to achieve results!


