July 31, 2025 Bitcoin forecast, quotes sourced from Binance.
Today, I mainly refined the larger structure as the framework for my subsequent analysis and predictions.
Weekly chart as shown:
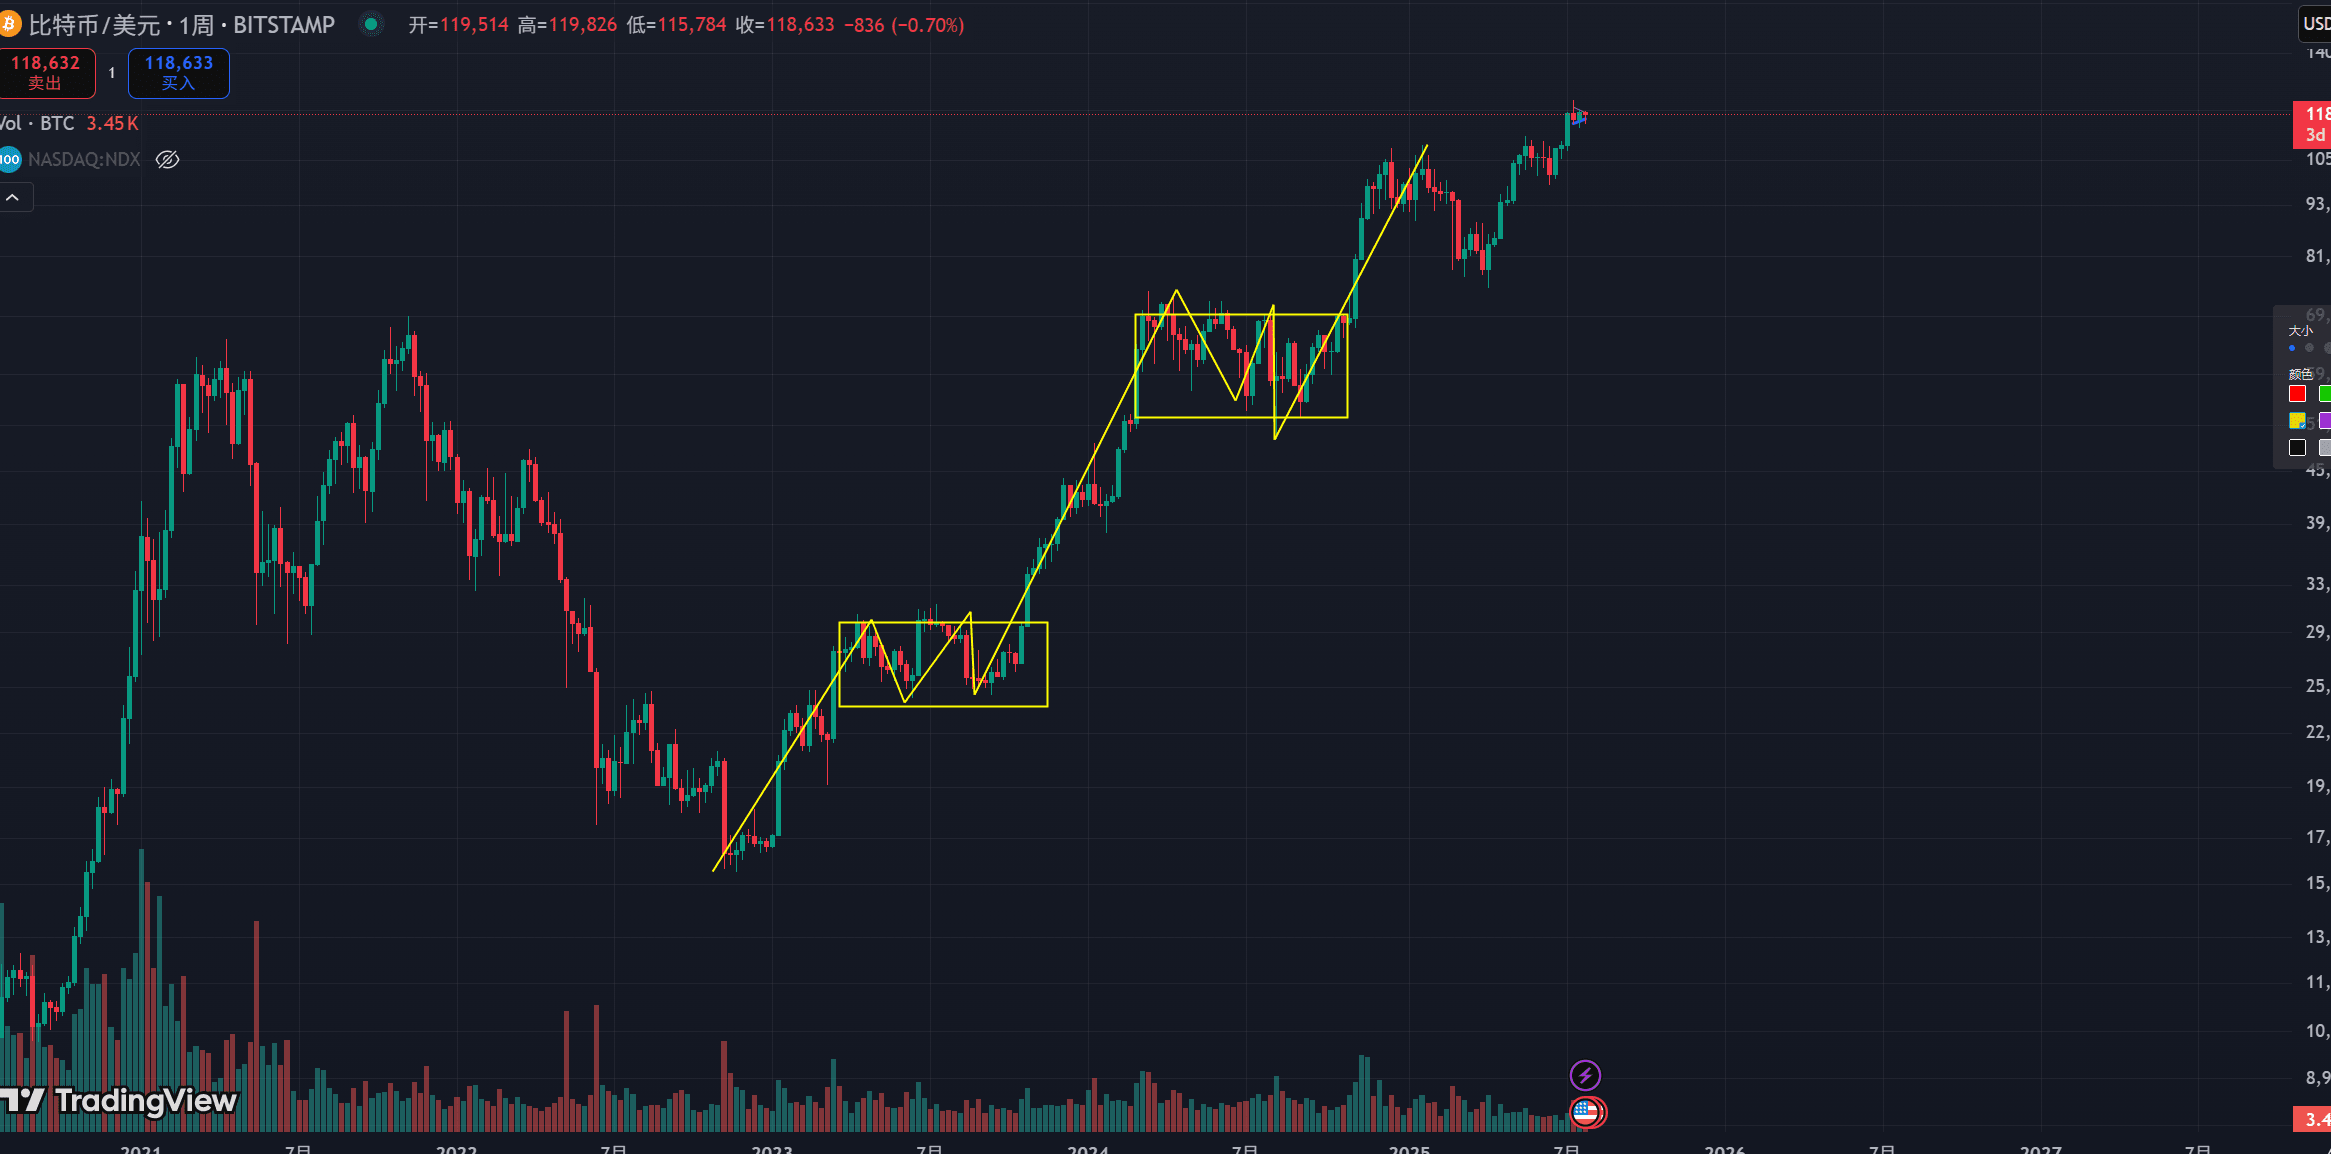
When it was at 109XXX USD, I had hypothesized a plan for the end of wave 5. The yellow lines in the chart ran a total of 5 strokes, and both the structural strength and time match very well. Wave 5 is viewed as the conclusion of the main bullish rise since 15XXX in wave theory. However, things didn't go as planned, and the market moved in the opposite direction, creating a new historical high.
Therefore, the hypothesis that wave 5 of the weekly structure has ended is naturally invalid. The only existing type of movement in the market is that wave 5 has not ended but has formed an ending wedge structure. Specifically, as shown in the diagram below:
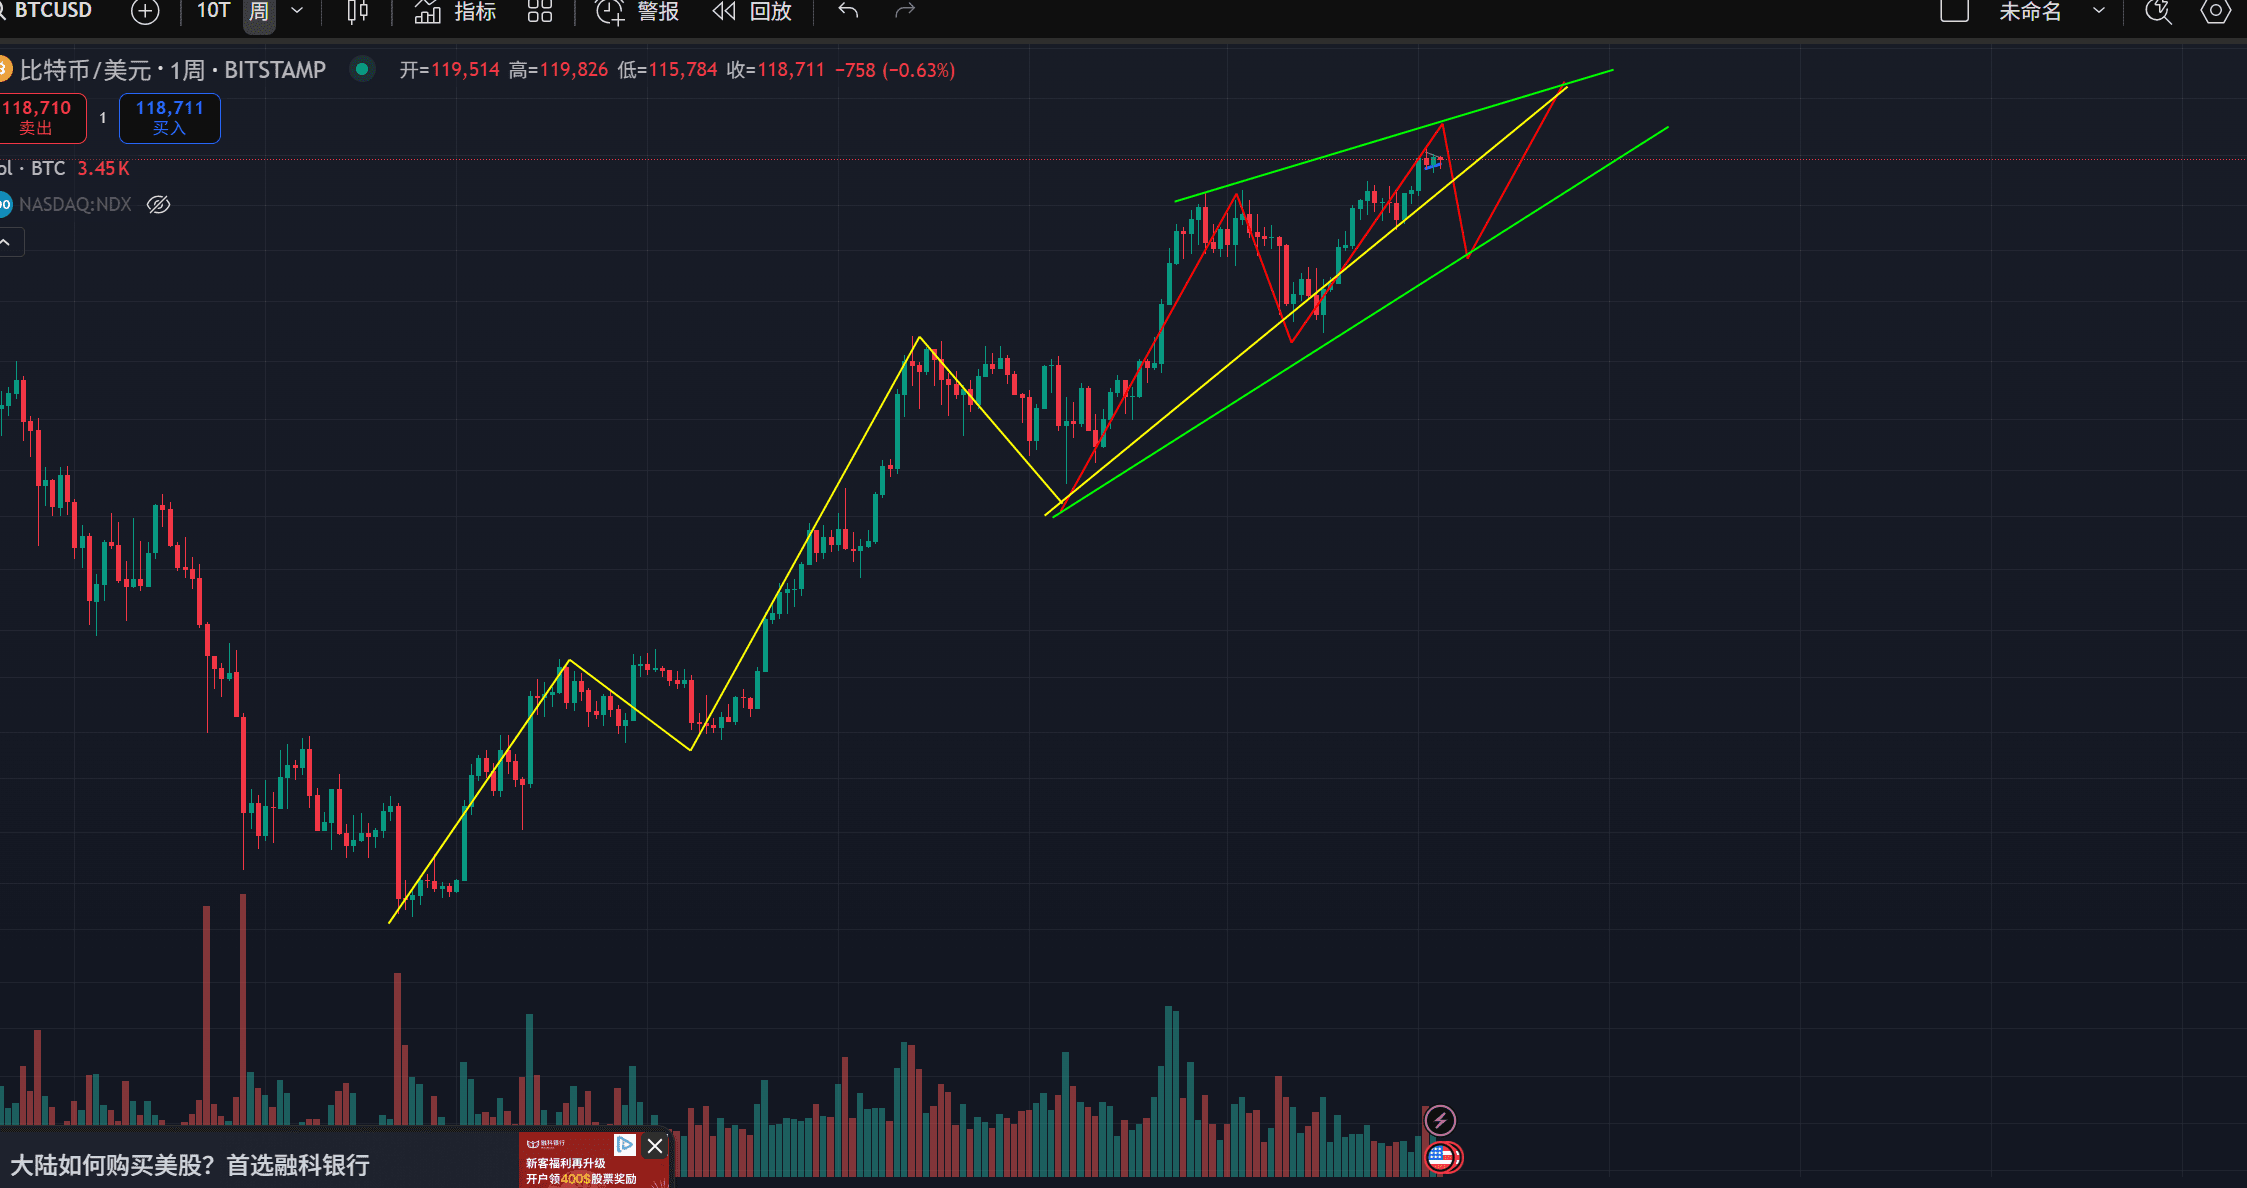
That is, the wave 5 is represented as a five-part red structure as shown in the diagram, where the internal structure of the wedge is 3-3-3-3-3, meaning that the internal structure of the sub-waves progresses in ABC form as 12345 waves.
Here, I will popularize some knowledge about wedges. The ending wedge, also known as the terminal tilted triangle, as the name implies, often concludes a previous trend when this pattern appears. The ending wedge appears in two positions, one is wave 5 and the other is wave C. When wave 5 presents an ending wedge, it is often followed by a sharp drop, returning to the starting point of the ending wedge. When wave C presents an ending wedge, a sharp rise will follow. The internal sub-waves of the ending wedge are in a 3-3-3-3-3 structure, where the inability of the action wave to form 5 waves itself represents a lack of bullish strength. The trend's progress has already reached a critical point, and the final resistance can only form a three-wave structure. Once the ending wedge completes 5 waves, this final struggle collapses, leading to a subsequent sharp opposite fluctuation, which is to be expected. These patterns in wave theory actually contain very profound rules and philosophies of human nature. Wave theory is essentially a portrayal of collective psychological behavior patterns.
The end of the main bullish wave signifies the conclusion of the market segment from 15XXX to the peak, indicating that the bull market is expected to end someday in the future. From the perspective of long-term spot trading, it is already in a stage of being ready to escape the peak at any time. There may still be another round to the previous high of 5-5, but as for the previous highs of the wedge, every previous high is a good opportunity to escape the peak!
Today's detailed explanation of the larger structure is to let everyone know the cycle we are currently in. It is not just following the crowd online. Eternal bull market? Does every feast end with you picking up the tab?
Returning to the perspective of the daily structure chart:
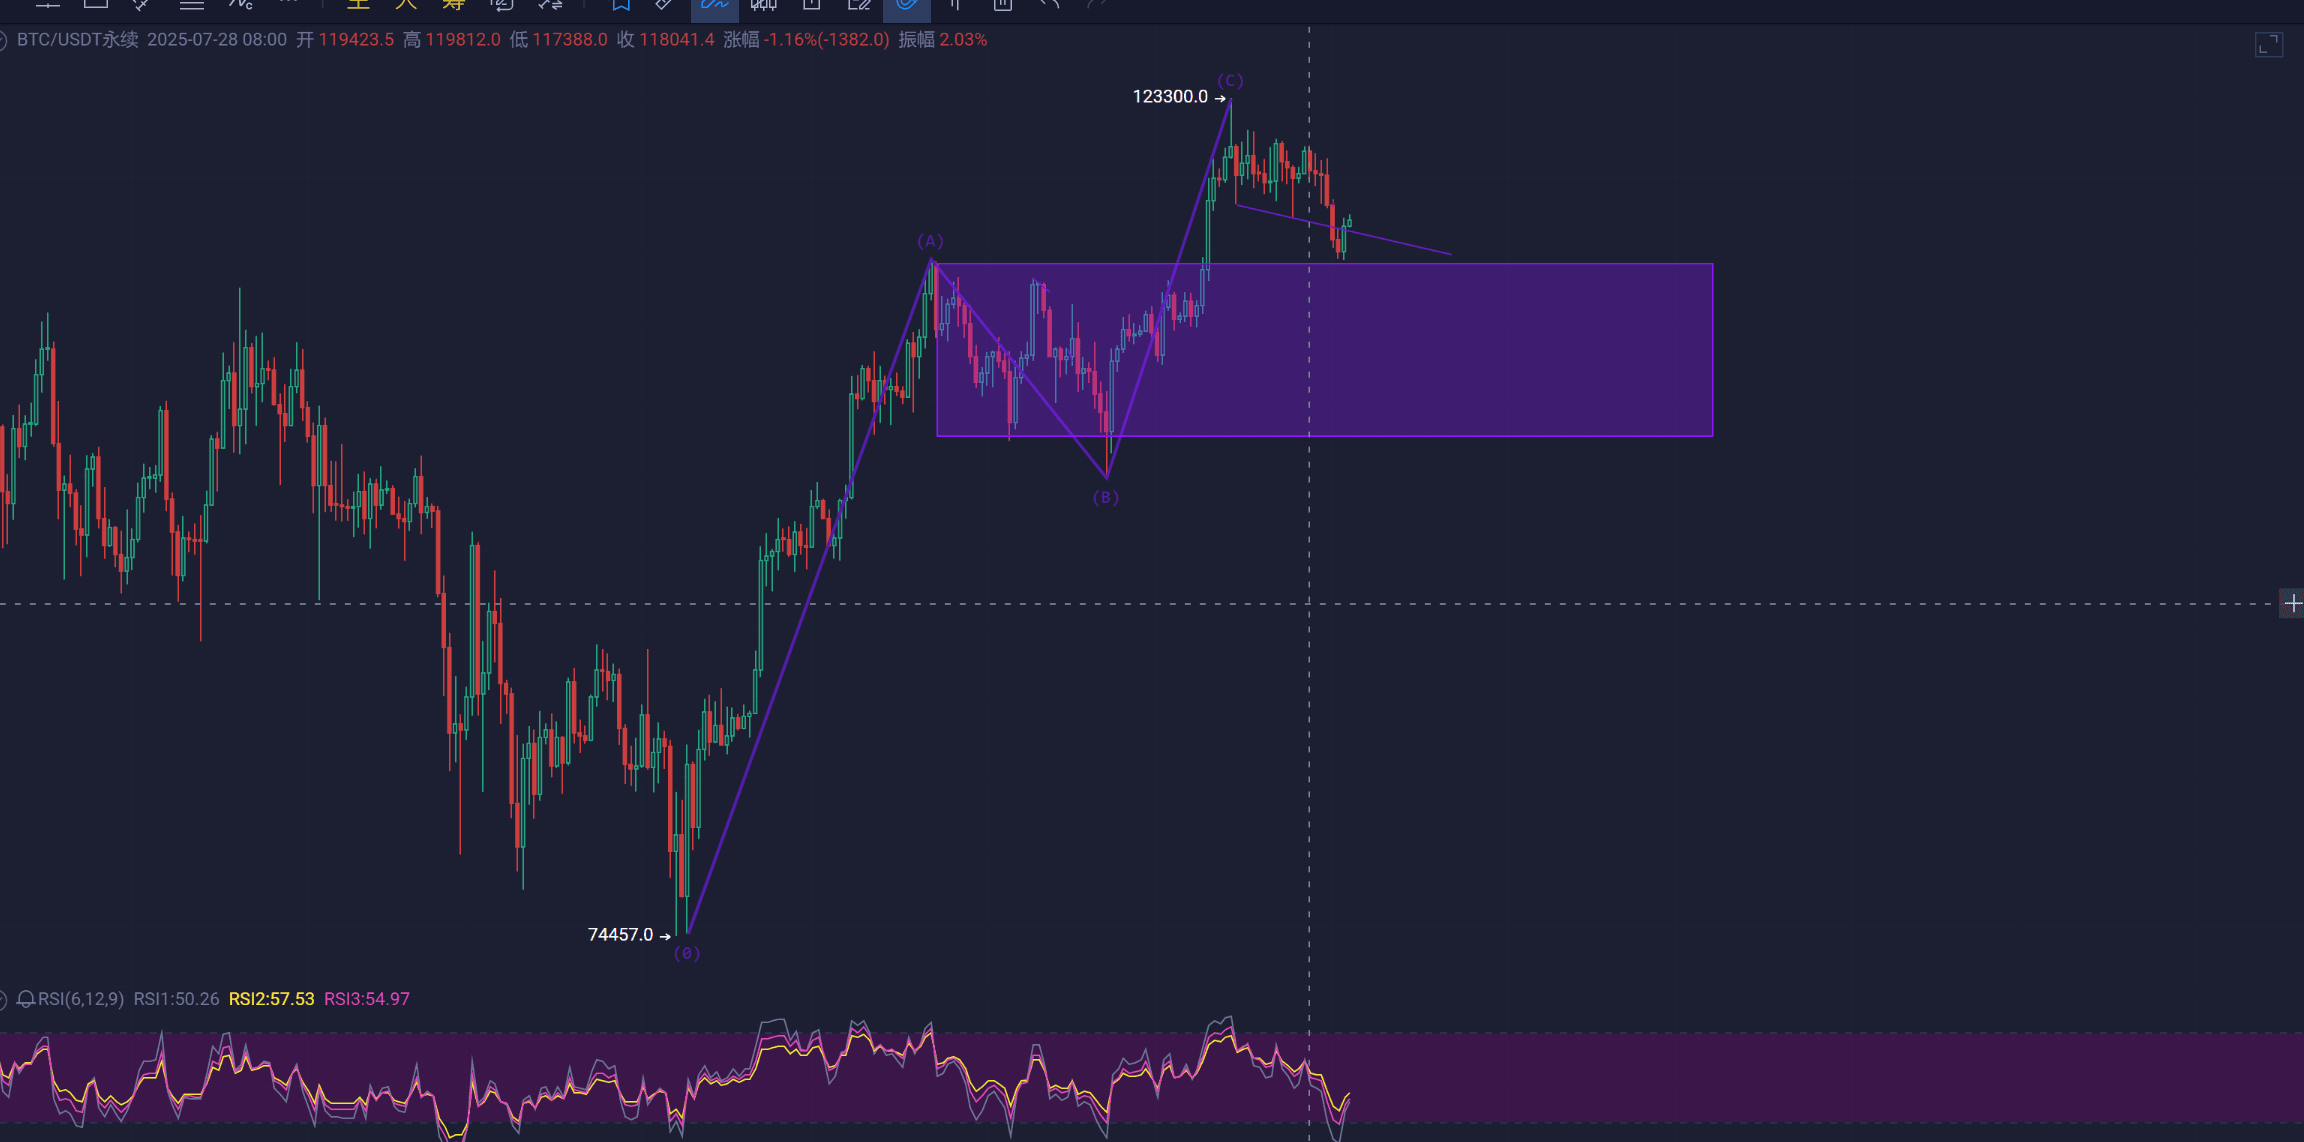
Currently, it seems that the ABC structure has completed, and the ongoing movement is the wave 4 structure, with the target for wave 4 at the lower boundary of the wedge, which is around 90000 USD.
In my trading process with Bitcoin, I personally believe that sometimes structures below the daily level can easily contradict.
Therefore, I propose a second type of movement here, which is still the wave 5-3 within the weekly structure since 74XXX.
However, this 5-3 is not an ABC structure but a 12345 structure, and this 12345 is also an ending wedge at the daily level.
As shown in the diagram below:
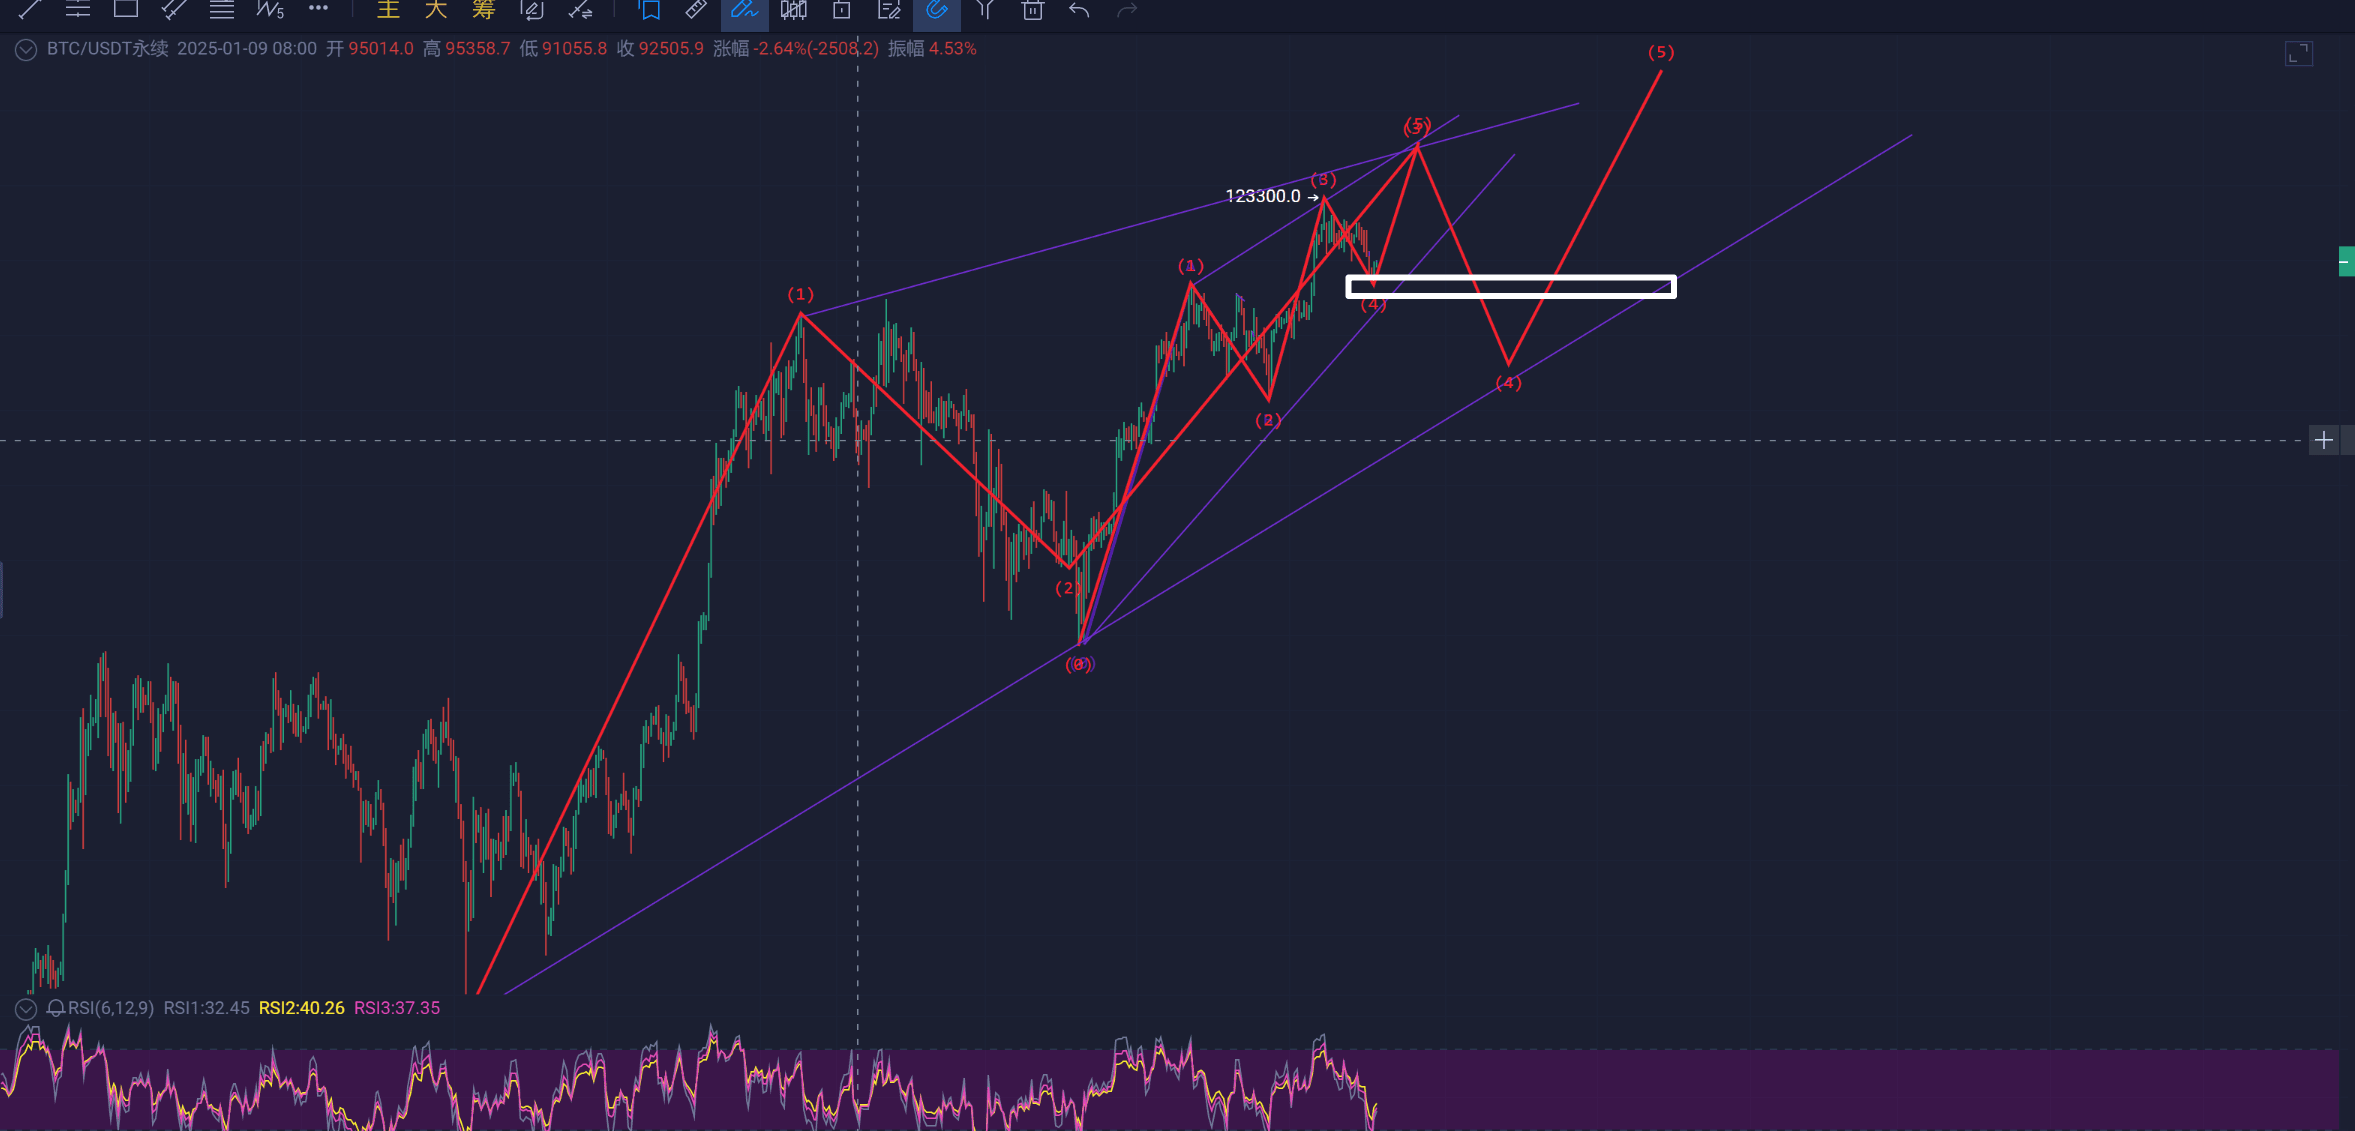
As for how to approach the short-term inclination assumption, should we directly touch 90000 here or hit a previous high before a drop?
Please look forward to the next article interpretation!
Welcome everyone to provide corrections, likes, and favorites.
Creating content is not easy; everyone's support is my motivation for creation!
If everyone doesn't support me, I might disappear in a few days.

