The market fundamentals are not too bad, but caution must be maintained.

In the face of recent bearish pressure, Shiba Inu (SHIB) has shown initial resilience, which may prevent further declines and support price increases. SHIB is nearing the level of $0.00001200, which is a critical support level consistent with multiple short-term technical areas and historical support after a pullback from the $0.00001500 area.
One of the most noteworthy signals recently is that Shiba Inu (SHIB) has shown a significant rebound from the $0.00001200 area, possibly forming a preliminary local bottom. The repeated testing of the lower shadows (Wicks) of the candlestick has failed to trigger further downward movement, indicating that price trends are beginning to stabilize.
The Relative Strength Index (RSI) is also recovering from the oversold area around 39, a value that has traditionally been seen as a signal of weakening selling momentum, which is expected to provide support for the subsequent rebound.
In terms of trend indicators, the 100-day and 200-day Exponential Moving Averages (EMA) are located near $0.00001330 and $0.00001430, forming a key mid-term resistance area. Once short-term prices stabilize and rebound, these ranges are expected to become targets for upward movement.
Currently, the 50-day EMA ($0.00001315) is the primary resistance for short-term trends. Whether it can successfully break through will be key to determining whether the rebound has continuity and will signify whether bullish forces have regained dominance.
From the perspective of trading volume, it remains neutral overall, with no signs of panic selling. Although large trading volumes have weakened recently, indicating a decline in whale activity, SHIB's current price structure is still within a larger sideways consolidation range.
In comprehensive analysis, Shiba Inu has not yet reached the highly speculative risk range, and the market has not shown irrational exuberance. At this stage, discussing 'adding another zero to the price' is evidently premature.
Bitcoin will not give up.
Bitcoin has recently pulled back from a local high of $123,000, reaching a turning point at the $112,000 mark. This area is significant not only because of the previous price movements but also due to its intersection with the 50-day Exponential Moving Average (EMA). Although Bitcoin is currently rebounding from this level, the EMA has historically been a dynamic support level in bullish trends.
After breaking through the consolidation range of $105,000 to $107,000 in June, Bitcoin surged to a local new high of $123,000. The subsequent pullback was expected due to declining trading volume indicating weakening momentum. However, since the RSI is still above 44, Bitcoin appears to remain stable in the neutral to bullish range and has not yet entered the oversold area.
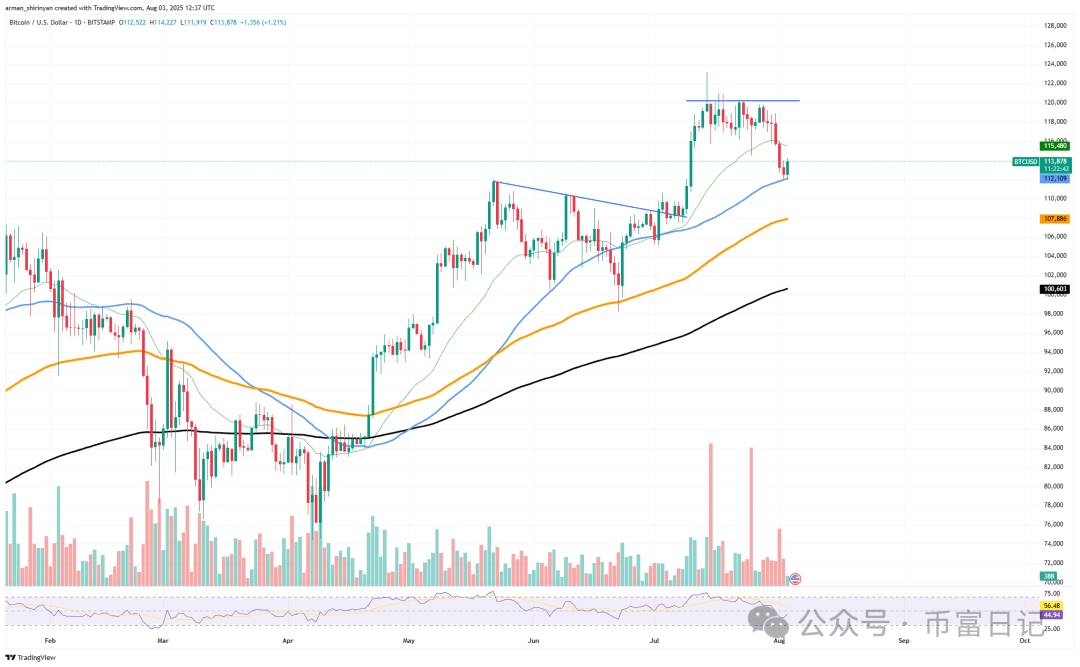
$112,000 is a key watershed for Bitcoin's price movement. Currently, BTC has been oscillating below this level for nearly a month. This price point not only corresponds to the dynamic support of the 50-day EMA but also coincides with the neckline position of a previous breakout pattern, holding high technical and psychological significance. For this reason, traders generally see it as an important node for potential rebounds or directional choices.
Currently, the 50-day EMA is still providing support. If it breaks down, it may test the 100-day EMA ($107,800) or even the 200-day EMA (slightly above $100,000). However, as long as the price remains above $112,000, Bitcoin's mid-term bullish structure still stands.
In short, $112,000 is not only a price support but also a basis for judging the direction of the trend: if it holds, it may restart the upward momentum and challenge above $120,000; if it fails, caution is needed to avoid entering a deeper adjustment cycle. Investors should closely monitor the gains and losses at this level.
Ethereum's mobility.
The recent decline in Ethereum may not be as frightening as it seems. The 26-day Exponential Moving Average (EMA) is a structurally robust level, and ETH is currently at this level after a healthy pullback, rather than a crash after breaking below $3,800. Historically, this level has been a turning point for trend continuation, and ETH's ability to maintain this level suggests it could become the starting point for a rebound to $4,000.
ETH's current price is $3,430, and the decline has begun to slow. The green line of the 26-day moving average has effectively cushioned the decline, and the market has rebounded from this area today, supporting the view that this may be a local bottom for this pullback. The RSI has fallen back from overbought levels and is in a balanced range around 53, providing more room for bulls to push prices higher without immediately overextending.
Ethereum's trading volume shows no significant signs of intensified selling, and market sentiment remains relatively stable, with buying gradually entering during recent declines, creating positive signals.
Currently, ETH's lower support structure is solid: the 50-day moving average ($2,992), the 100-day moving average ($2,900), and the 200-day moving average ($2,704) collectively form a multi-layered support zone covering the $2,700–$3,000 range, providing a solid defensive line for prices.
If ETH can effectively break through the resistance level formed by the $3,600 pullback point, the short-term target is expected to point towards $3,950–$4,000, which corresponds to the previous rebound high point area.
Considering that Ethereum is still operating above the main mid-term support level, the overall structure remains bullish. In summary, the prerequisite for ETH to continue its upward movement is to stabilize above the 26-day moving average, and breaking through $3,600 may lead it back to the $4,000 mark.


