COIN NAME : $BTC
SIGNAL TYPE : SHORT
👇👇💵
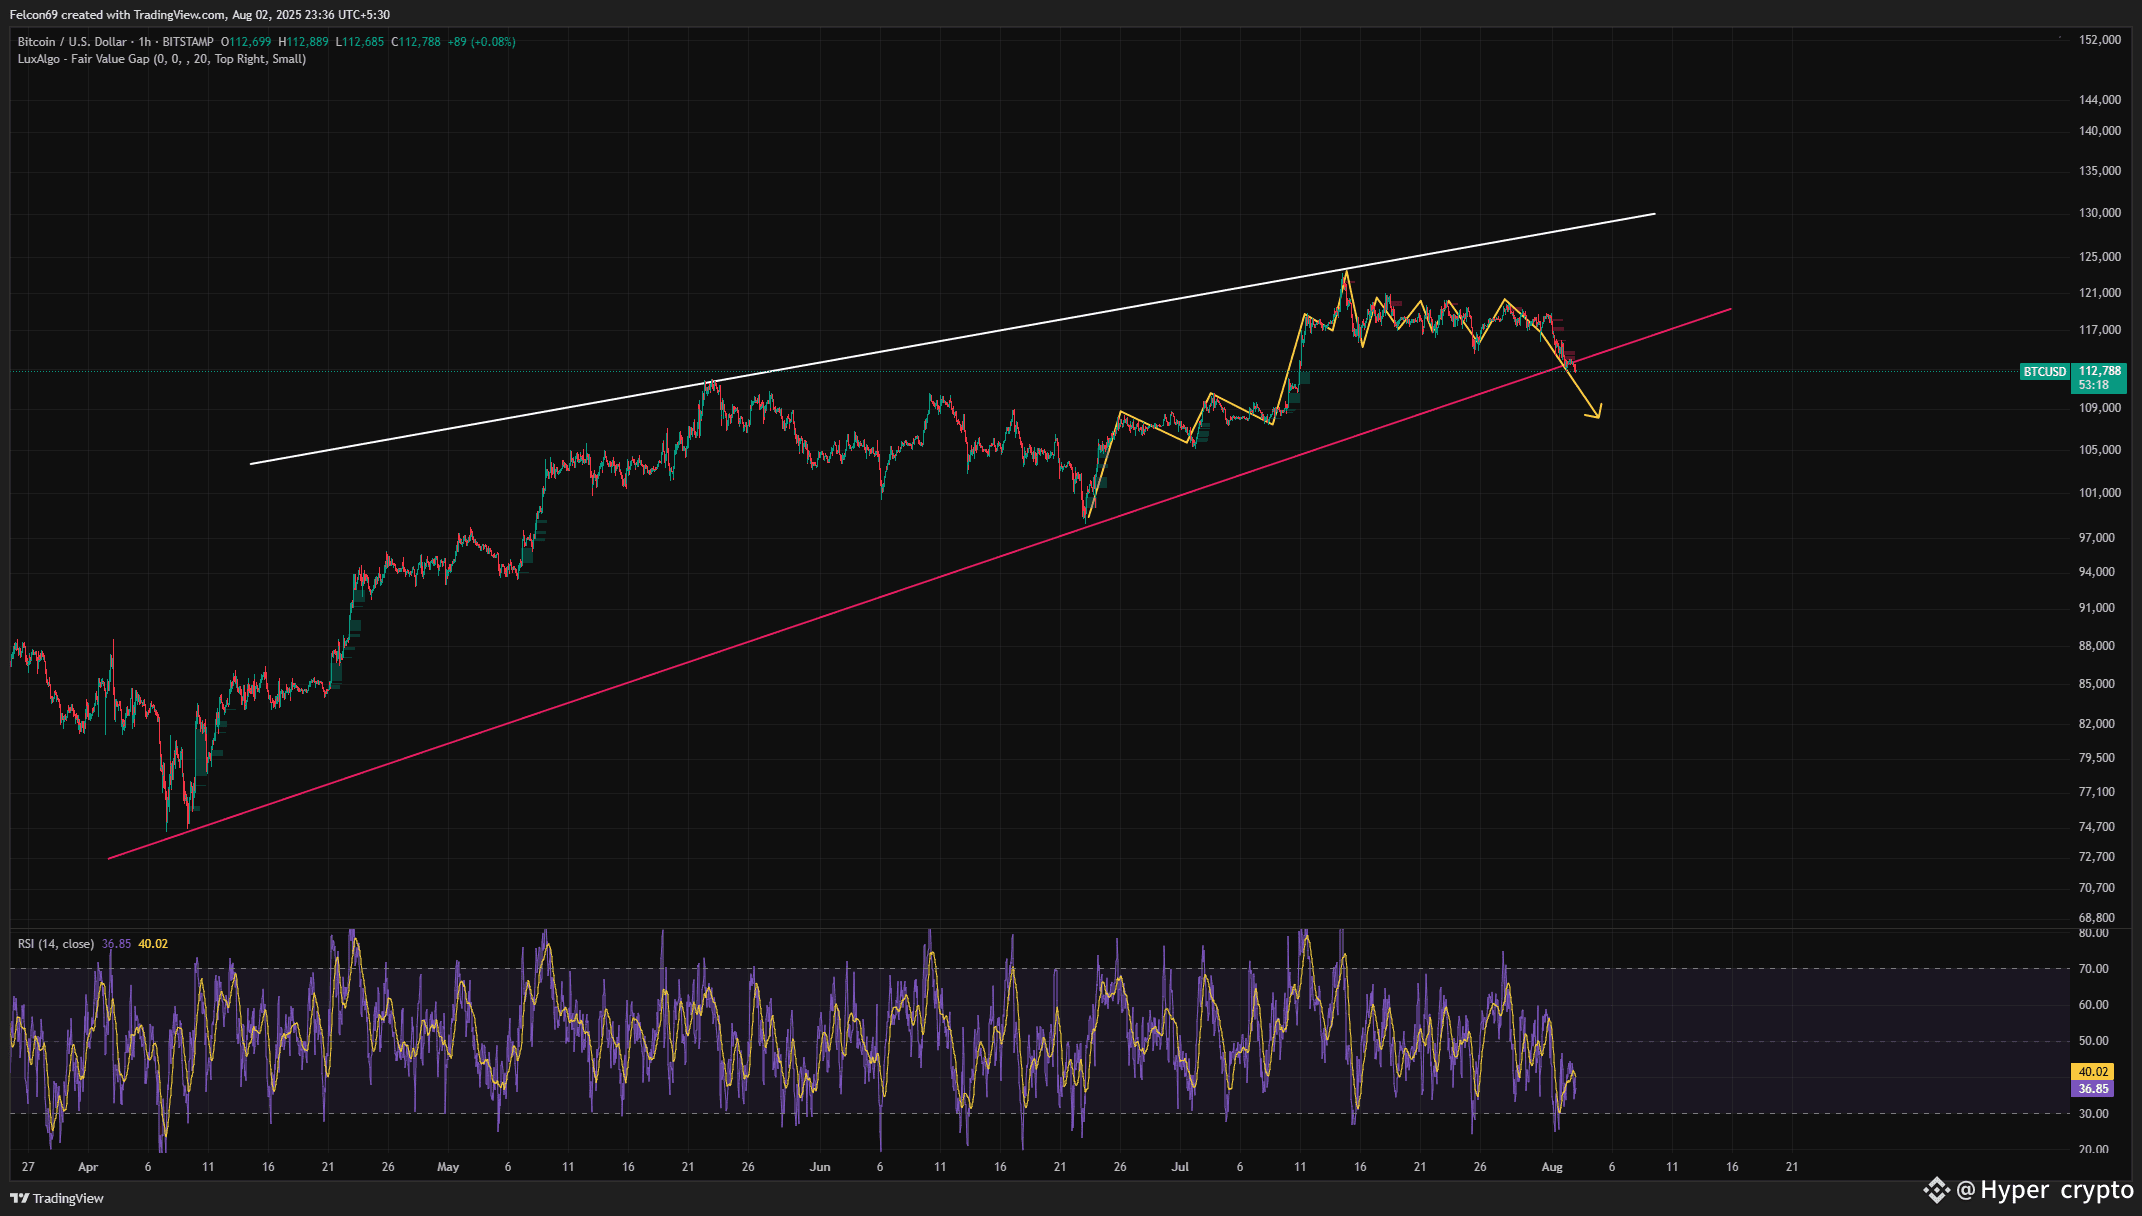
1) I can see on BTC 4H chart shows a rising wedge pattern 📉 — typically a bearish structure. Price has broken below the ascending trendline, hinting at a potential drop 📉. The RSI is also below 30, indicating bearish momentum 🧨 and potential further downside. The yellow arrow forecasts a continuation lower if support fails.
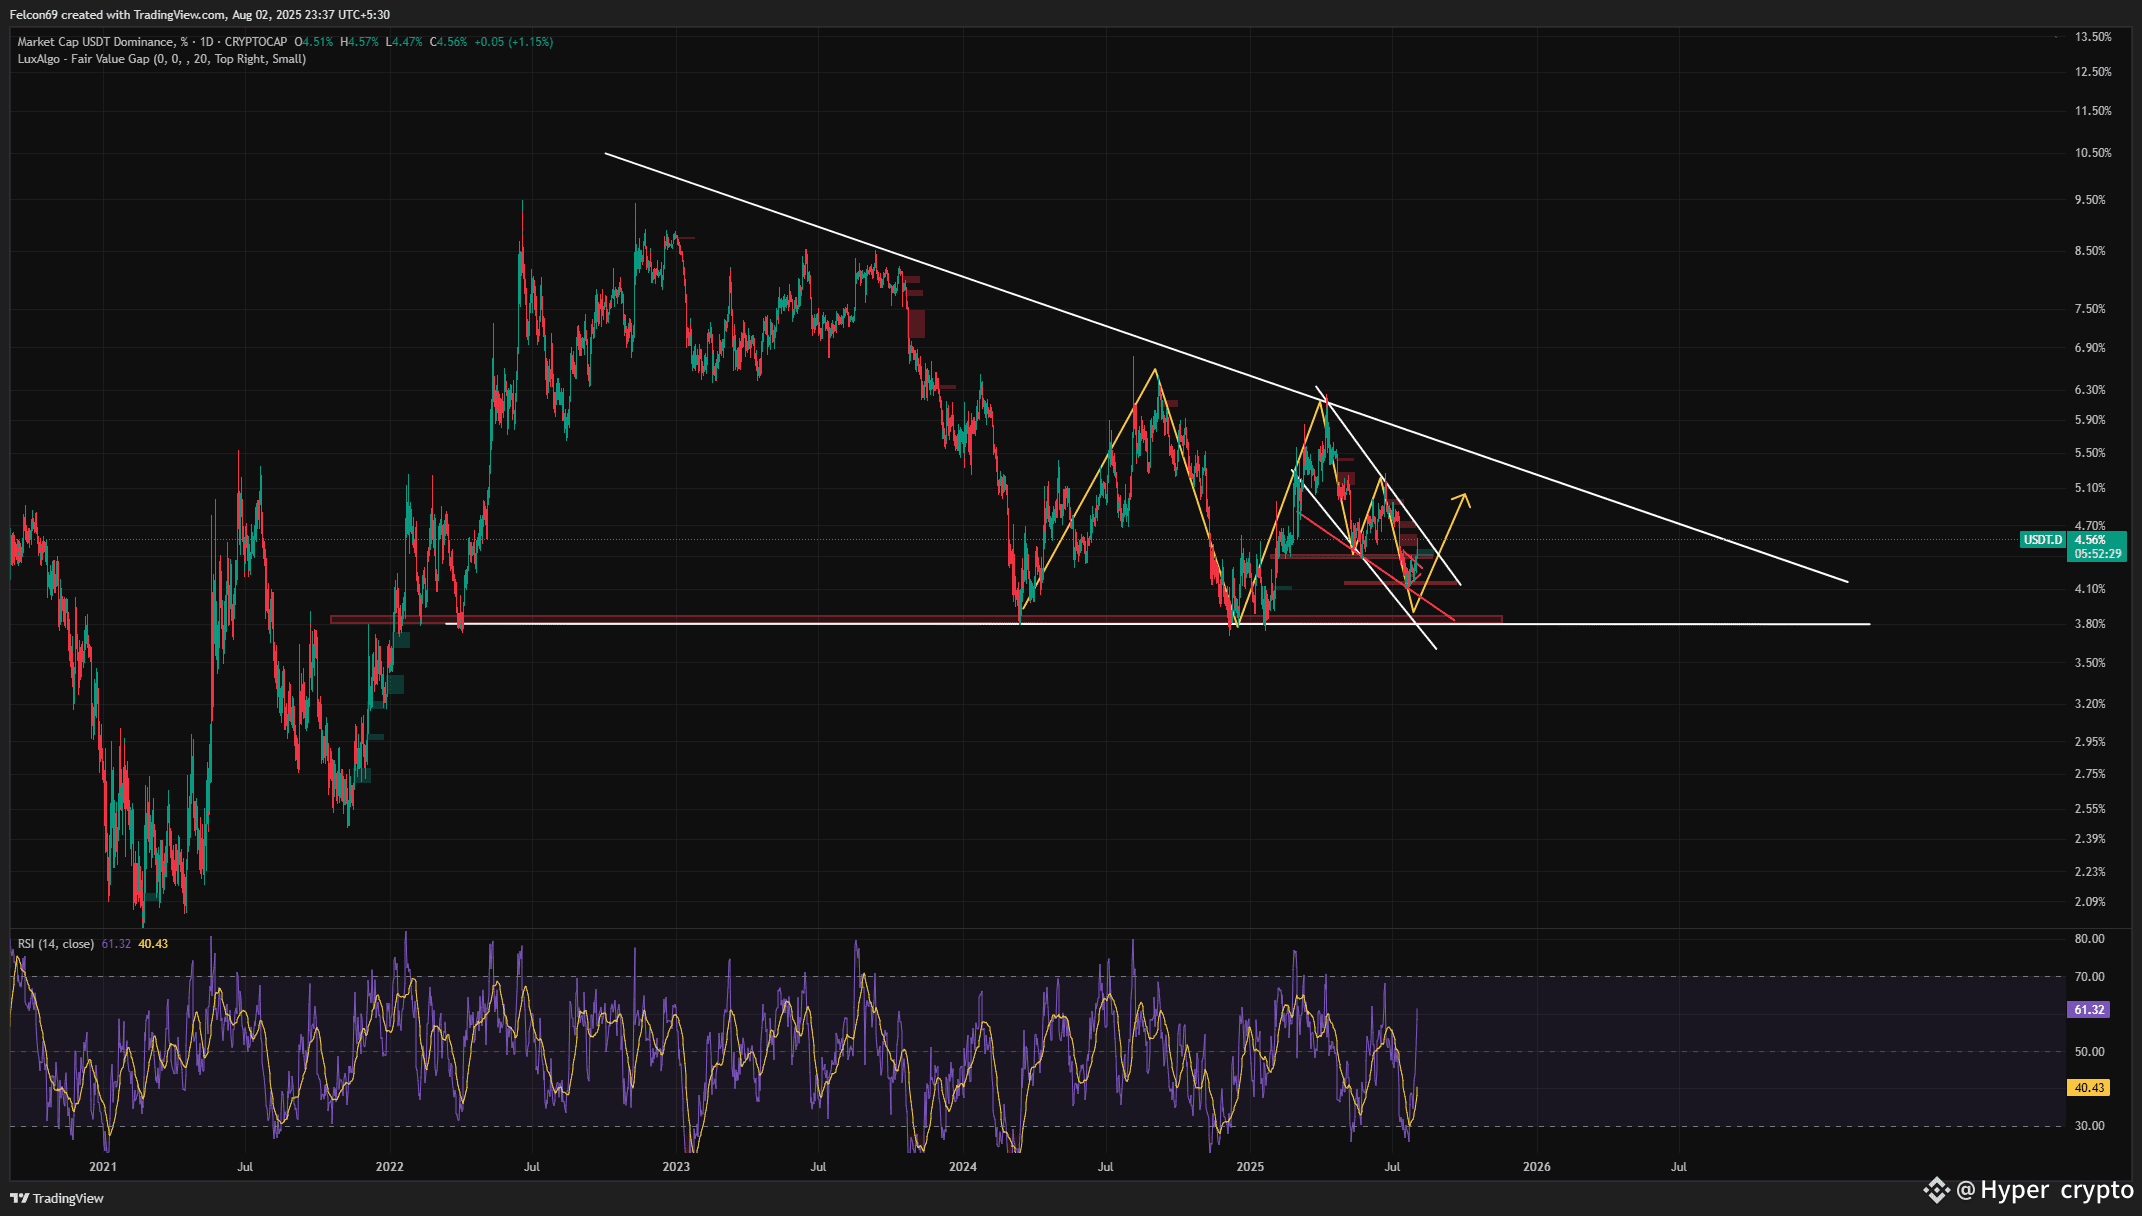
2) I can see USDT.d alredy breck there resistance line and its make bullish pattern . As u can see it will be pump more and market will fall more.
(JOIN OUR BINANCE LIVE SECTION FOR MORE DEATAILS AND UPDATE INFORMATION)
ENTRY PRICE: 112952(or market price)
1st tp: 111494
2nd tp: 109628
3rd tp: 108636
Leverage: 40x
(JOIN OUR BINANCE LIVE SECTION FOR MORE DEATAILS AND UPDATE INFORMATION)
