COI NAME : $BTC
SIGNAL TYPE: LONG
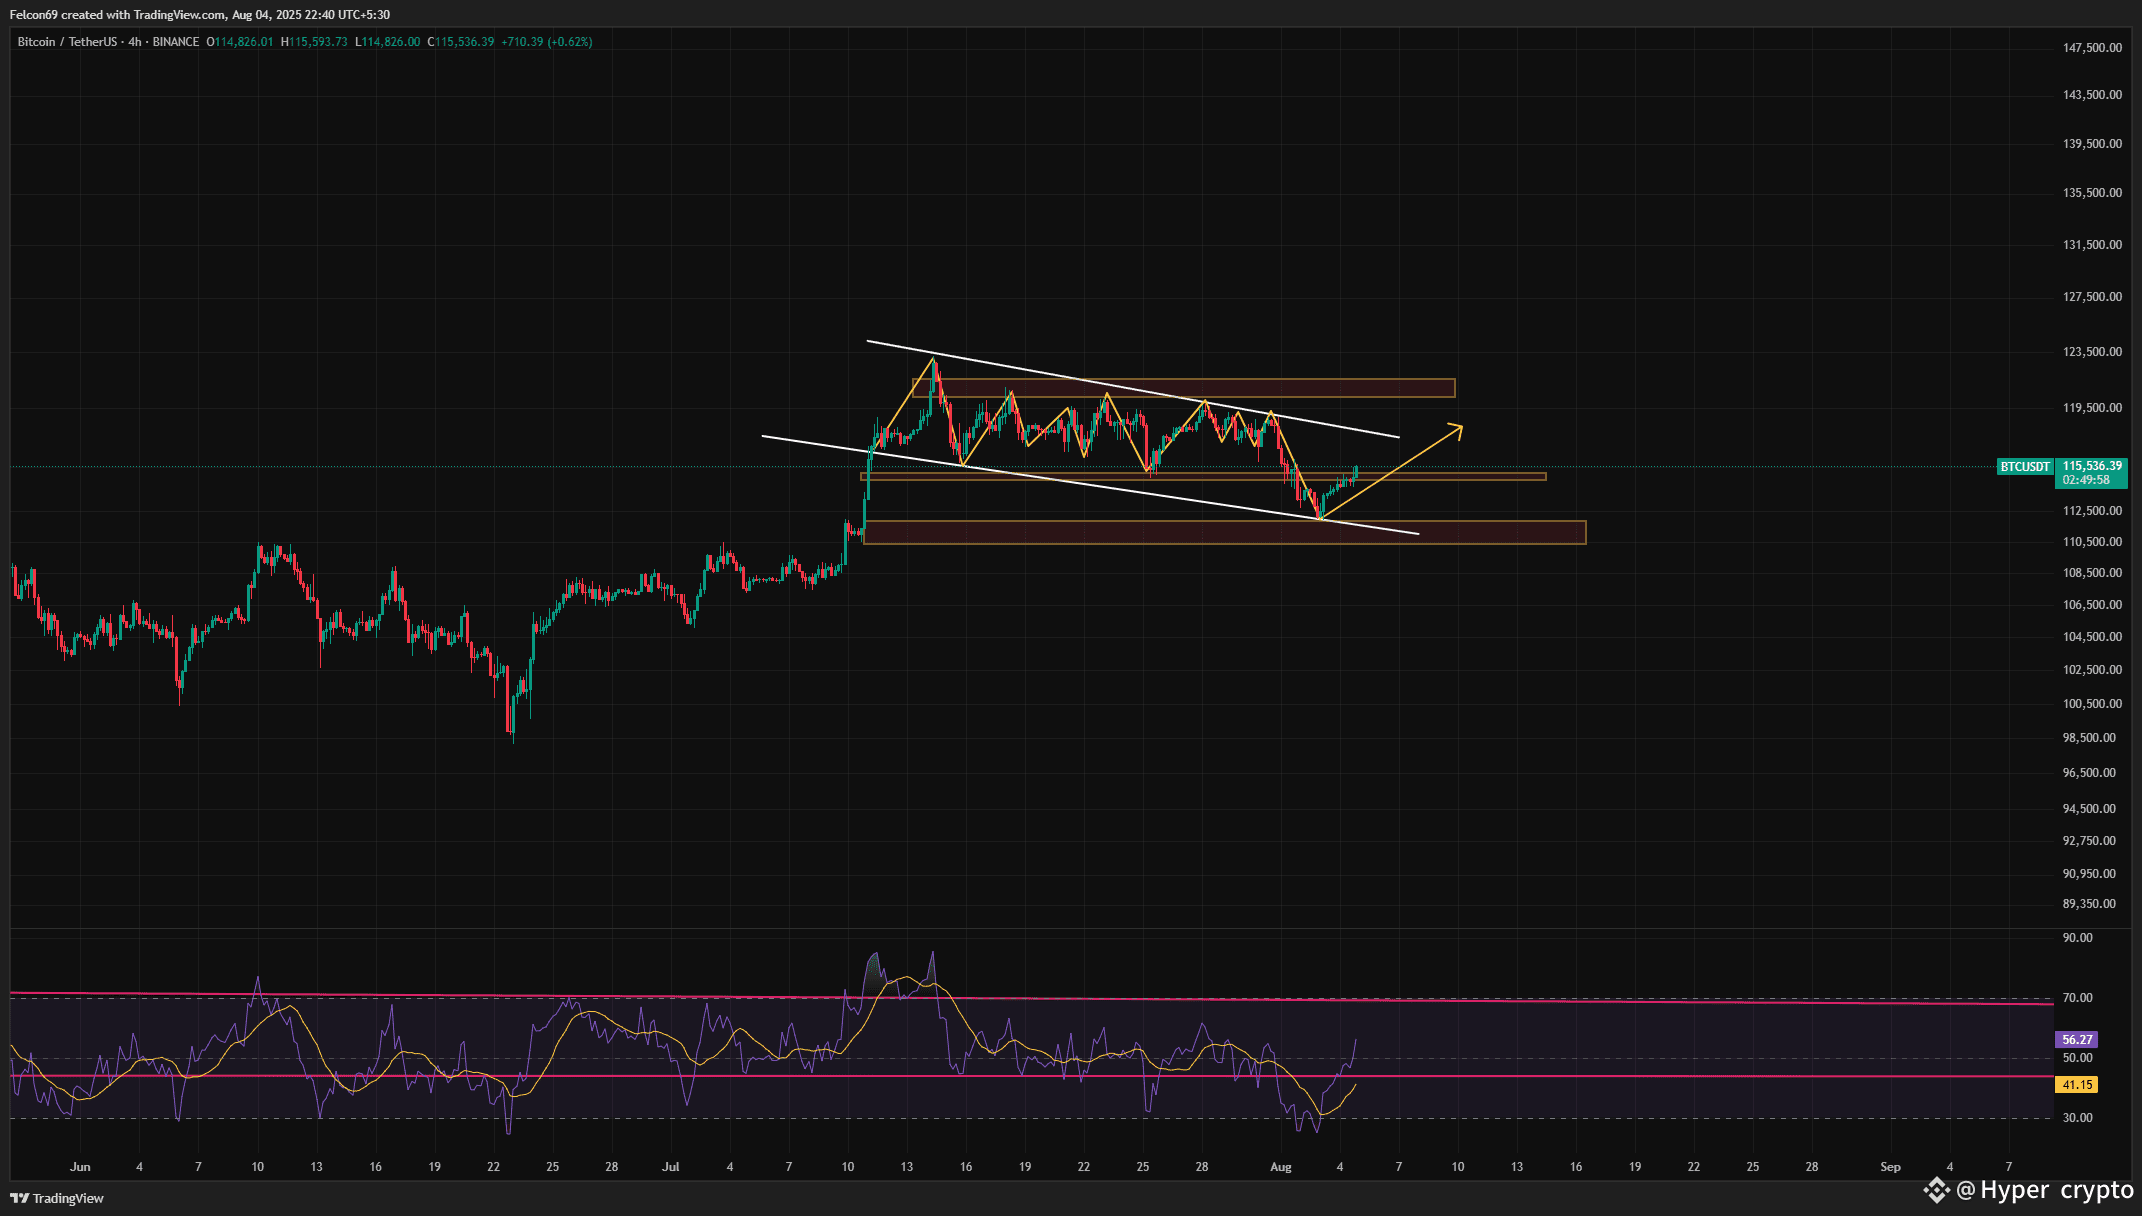
This chart 📊 shows Bitcoin (BTC) on the 4-hour timeframe from Binance. Price is moving within a falling wedge pattern 🔻, a typically bullish setup that hints at a potential breakout 🚀. The repeated rejections from the upper and lower trendlines 🔁 show consolidation and indecision. BTC recently bounced off a strong support zone 🛑 at the wedge’s lower boundary, aligning with the RSI rebounding from oversold levels 📈 (RSI now above 55). The orange zones represent supply (resistance) and demand (support) areas 🔸, where price may react. If BTC maintains momentum, a breakout above the wedge may lead to a push toward the upper supply zone 📈💥. However, failure to hold the recent support could result in retesting lower zones ⚠️. Overall, the structure suggests accumulation and a possible bullish move ahead. As always, DYOR 🔍 and manage risk—crypto remains highly volatile 🌪️.
(JOIN OUR BINANCE LIVE SECTION FOR MORE DEATAILS AND UPDATE INFORMATION)
ENTRY PRICE: 115392.67 (or market price)
1st tp: 116263.01
2nd tp: 117746.63
3rd tp: 118300.92
Leverage: 20x
(JOIN OUR BINANCE LIVE SECTION FOR MORE DEATAILS AND UPDATE INFORMATION)
