🚀 OG/USDT Breakout Analysis – A Strong Bullish Setup!
---$OG
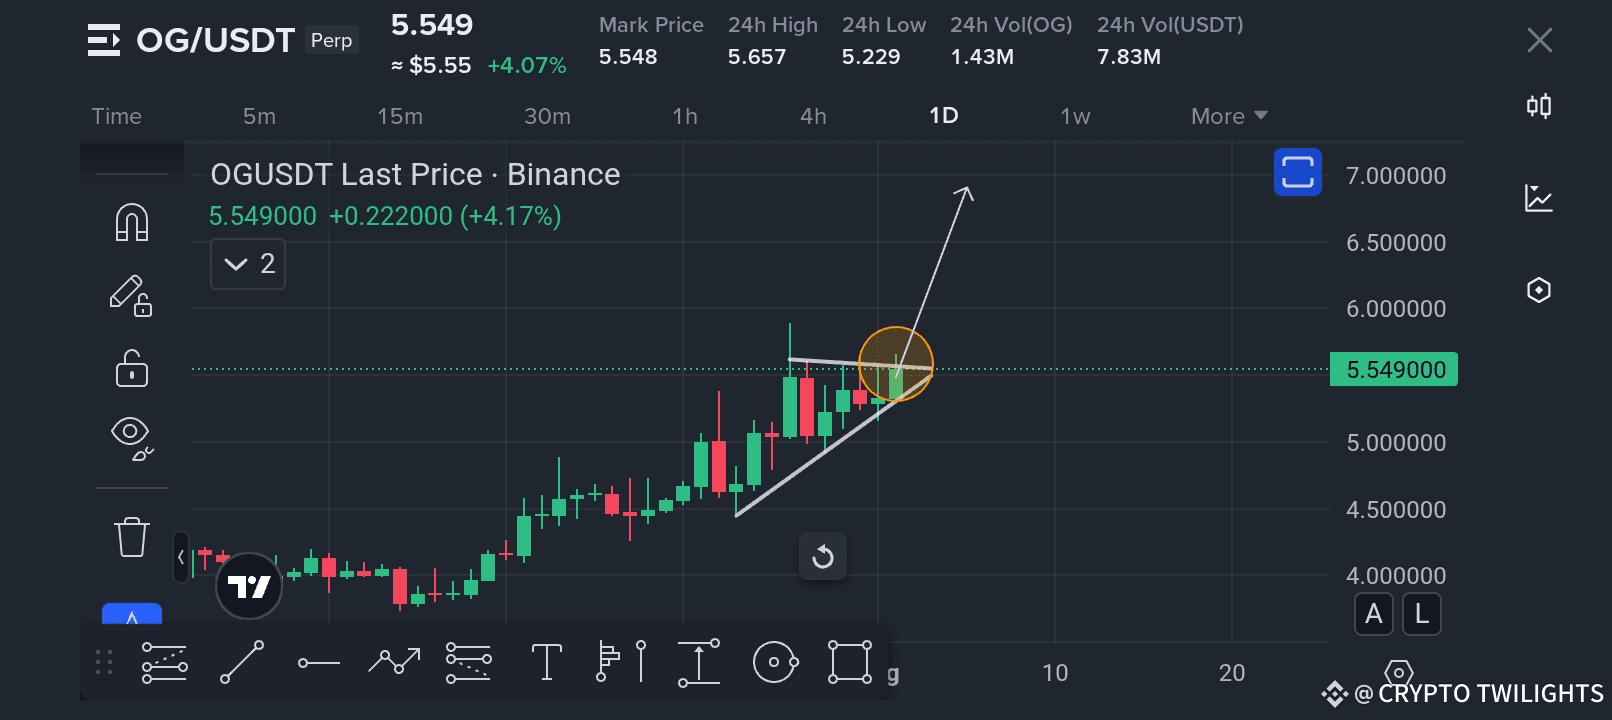
The chart for OG/USDT on the daily timeframe (1D) is looking extremely promising. After a steady climb and multiple tests of the resistance zone, the price is showing signs of a breakout from a bullish ascending triangle pattern.
✅ Current Market Snapshot
Last Price: $5.55 (+4.17%)
24H High: $5.65
24H Low: $5.22
Volume: Increasing, which indicates growing interest from buyers.
📊 Technical Analysis
The price has been respecting an ascending trendline, showing continuous higher lows – a clear indication of strong buying pressure.
The breakout point around $5.50 was a major resistance, and the recent candle closing above it is a strong bullish signal.
If momentum continues, the price could accelerate toward the next key zones.
🔑 Key Levels to Watch
Immediate Support: $5.20 – $5.30
Immediate Resistance: $6.00
Next Target Zones:
First Target: $6.20
Second Target: $6.50 – $6.80
Potential Extension: $7.00+ if volume sustains.
🧐 Why This Breakout Matters
This setup combines price action confirmation and bullish structure, which is often followed by strong upward momentum. The ascending triangle pattern is a continuation pattern, meaning the breakout aligns with the prior bullish trend.
⚠️ Risk Management
If price falls back below $5.30, the breakout may be invalidated.
Always use a stop-loss and manage position sizing carefully.
📌 Outlook: Bullish, as long as the price stays above the breakout zone and the trendline.
💬 What do you think? Will OG hit $6.50+ in the next few sessions? Drop your thoughts below!
#Crypto #OGUSDT #PriceAction #Breakout #TradingAnalysis #BullishTrend
---