---$PUMP
[PUMP/USDT] – A Clear Breakout from the Triangle Pattern: Technical Analysis in Action
In the world of trading, the market constantly communicates with us through patterns, volumes, and levels. Our task is not to predict the future blindly but to interpret what the charts are saying in real-time and prepare for high-probability scenarios. The recent move in PUMP/USDT is a perfect example of how classical chart patterns can anticipate major price actions when combined with market context and structure.
The Setup – Reading the Chart Before the Move
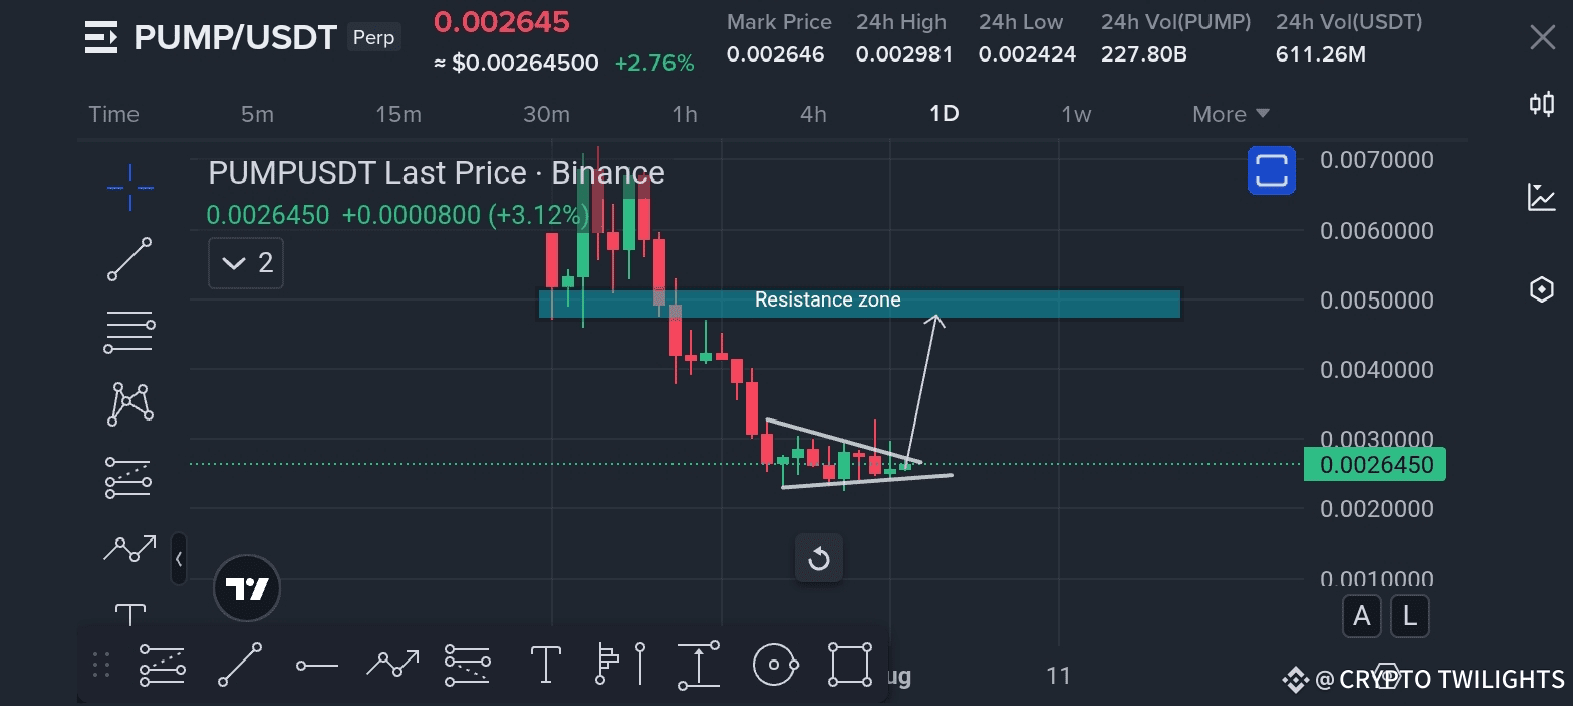
On the daily timeframe (1D), PUMP/USDT was in a clear downtrend for several sessions, with strong red candles pushing the price downward. However, as price approached the 0.0024 – 0.0025 region, the bearish momentum started to slow. This wasn't just visible in the size of the candles, but also in the wicks forming at the bottom — suggesting buyers were starting to step in and defend that zone.
What followed was the formation of a symmetrical triangle pattern — a neutral pattern often indicating consolidation and indecision between bulls and bears. However, in the context of a downtrend showing weakening selling pressure, this triangle began to look more and more like a reversal setup.
The triangle was constructed with:
Higher lows: Indicating gradual strength building up from the buyers.
Lower highs: A sign of continued but weakening seller pressure.
Decreasing volume: A classic characteristic of tightening price range, typically preceding a breakout.
Most importantly, this triangle appeared after a sustained decline, hinting at the possibility of a trend reversal rather than just a continuation pattern.
Resistance Zone: The Target Zone
A major factor I considered in the analysis was the resistance zone between 0.0045 and 0.0055. This level acted as a previous supply area where sellers had overwhelmed buyers during the last swing. If a breakout were to occur from the triangle, this resistance zone would likely become the first major target area.
The analysis was based on structure, not speculation. The logic was simple:
If buyers can break above the triangle with strong momentum and follow-through volume, there’s a high probability they’ll aim for the previous consolidation or rejection zone — in this case, the 0.0045–0.0055 area.
This would represent a potential 20%+ move from the triangle breakout point.
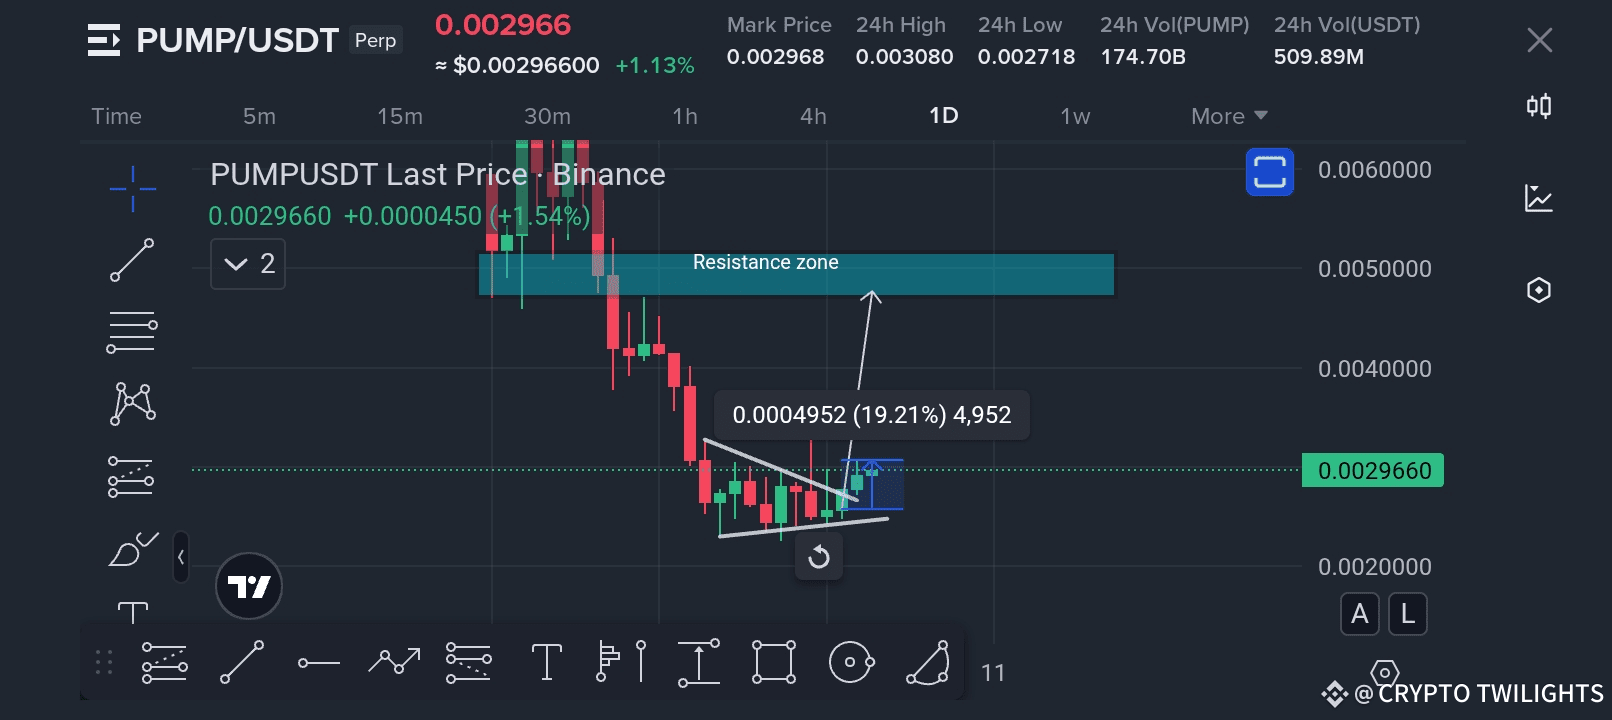
The Breakout – Confirmation of the Pattern
Soon after the triangle pattern matured and price compressed into the tip, the breakout occurred. A bullish candle pierced through the upper trendline of the triangle with notable strength and volume. This was the exact confirmation I had anticipated.
On the following day, price surged further, confirming the breakout with a clean continuation. The market responded precisely as predicted — with a +19.21% increase, pushing the price from approximately 0.00248 to around 0.00308, heading directly toward the predefined resistance zone.
The reaction was not based on hype or unexpected news — it was purely a technical move. Price respected the geometry of the pattern, responded to compression with expansion, and fulfilled a common breakout target.
Why This Pattern Worked
There were a few reasons this setup worked so effectively:
1. Market Context: After a steep sell-off, sellers appeared exhausted. The triangle pattern offered the first sign of accumulation and rebalancing.
2. Volume Behavior: As price consolidated, volume dried up — a precursor to a breakout as the balance of supply and demand shifts.
3. Clear Levels: Both support and resistance were well-defined. This clarity allowed for straightforward risk management and target setting.
4. Pattern Symmetry: The triangle was well-formed and tight, providing precision for the breakout area and timing.
Lessons from the Trade
This setup reinforces several important lessons for any trader:
Patterns are powerful when placed in the right context. A triangle in a strong trend can act as a continuation pattern, while in a weakened trend, it may signal reversal.
Patience pays off. Waiting for a pattern to complete and for confirmation avoids unnecessary risk.
Technical analysis is not magic — it's probability. This move wasn’t guaranteed, but it was a high-probability outcome based on the structure.
Final Thoughts
Chart patterns like triangles, flags, and wedges are often overlooked or dismissed in volatile markets, especially in the crypto space. However, they remain some of the most reliable tools in a trader’s arsenal when used correctly and in alignment with volume, context, and broader market structure.
The recent PUMP/USDT move was a textbook case — not just of price behavior but of disciplined, structured analysis. Understanding price action at this level doesn’t just lead to better trades — it builds confidence in the strategy and the process.
---