
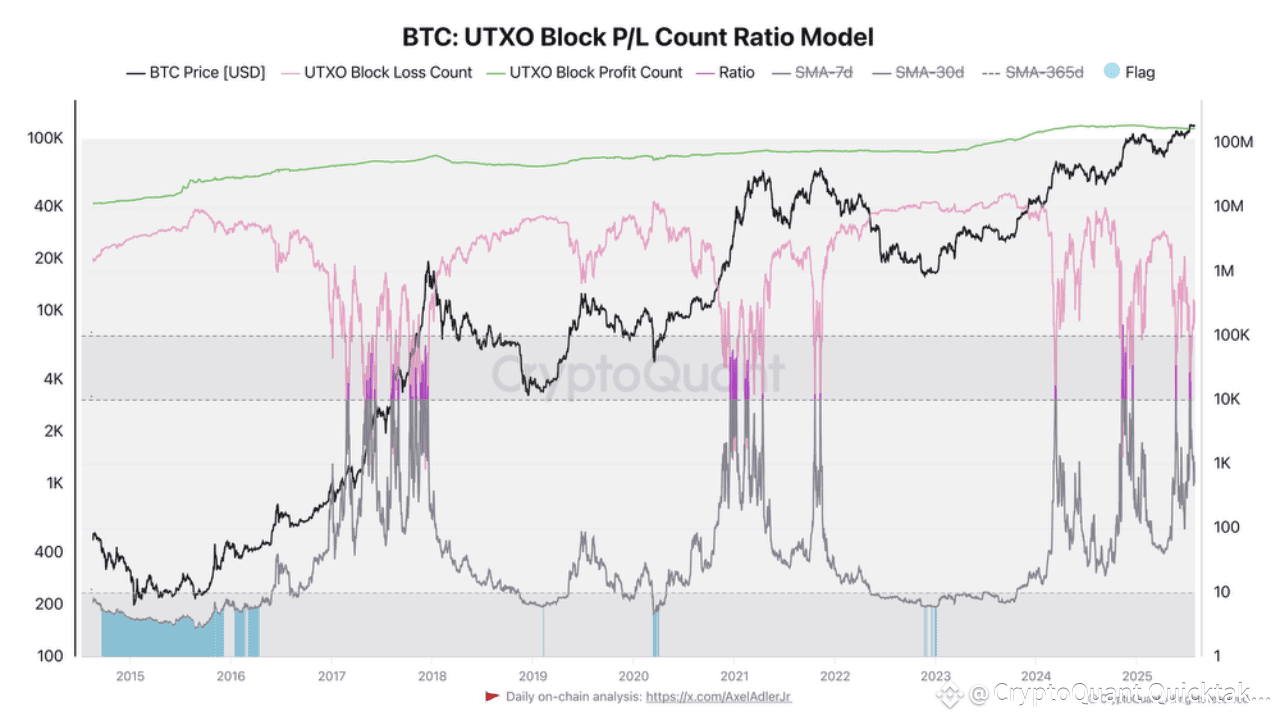
This chart, based on UTXOs (from the block data), highlights the number of UTXOs spent either in profit or in loss.
It’s important to note that we are counting the number of UTXOs, instead of focusing on value, this chart focuses on count.
—💡It’s a more effective way to capture the overall market sentiment, the dominant one, and helps filter out the noise that value-based metrics can often produce —
🔹 The first striking observation is that UTXOs spent in profit are overwhelmingly dominant.
Since the creation of Bitcoin, making a profit has been relatively straightforward 👉🏼 buy and wait.
So ultimately, generating profit is mostly a matter of the investor's patience.
🔹 To understand the current prevailing market sentiment, we can rely on two key metrics from this chart :
• The evolution of UTXOs spent at a loss
• The ratio between UTXOs spent in profit and those spent in loss
It provides 2 signals one when profitable UTXOs strongly dominate (🟣), and another (🔵) when their dominance drops sharply.
Between July 11 and 13, the number of UTXOs spent at a loss dropped significantly.
This means that at that price level, many holders found themselves in profit and chose to realize it.
💥 As a result, the ratio also surged, exceeding the 10,000 mark, meaning UTXOs closed in profit were 10,000 times more numerous than those closed in loss.
Today, the ratio has dropped (to around 500), which suggests that profit-taking has calmed down and that even minor price drops are now enough to push the more impatient holders to realize losses.
Written by Darkfost

