I know a friend from Shanghai who enjoys trading spot markets and occasionally contracts. He is particularly enthusiastic about bottom fishing, increasing his position as prices fall. In just a few years, he has gone from small to large, and now he is a professional trader in the crypto space.
I have improved his 'RSI Indicator + 3 Essential Profit Techniques', and after practical application this year, with an initial capital of 100,000, he has turned it into 4 million in six months. I hope this can help the fans!
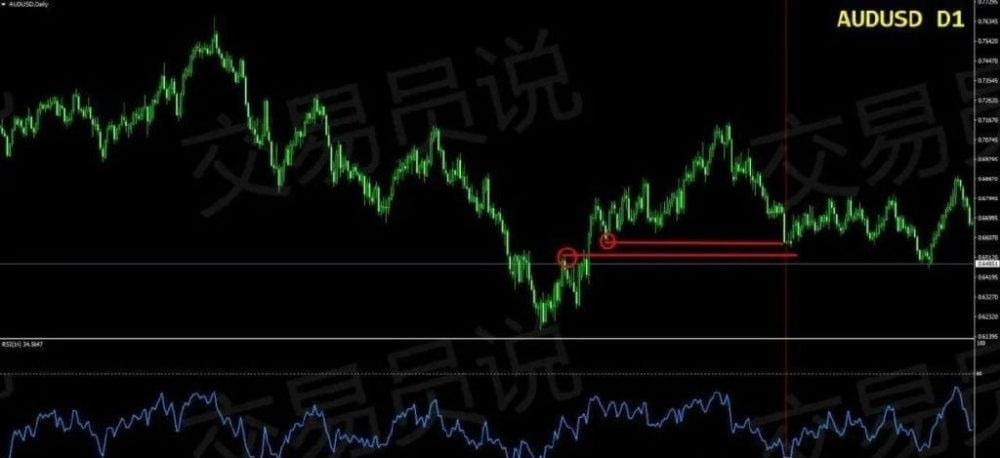
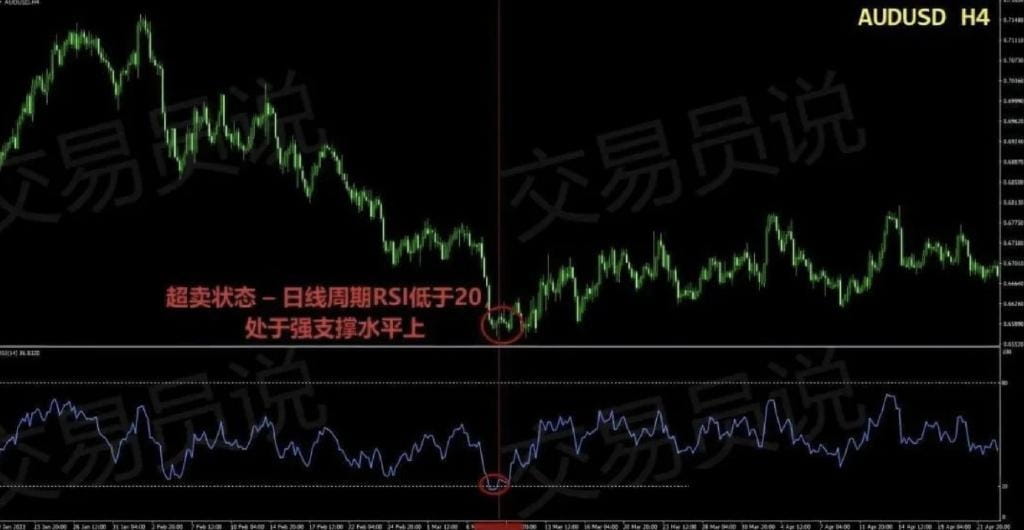
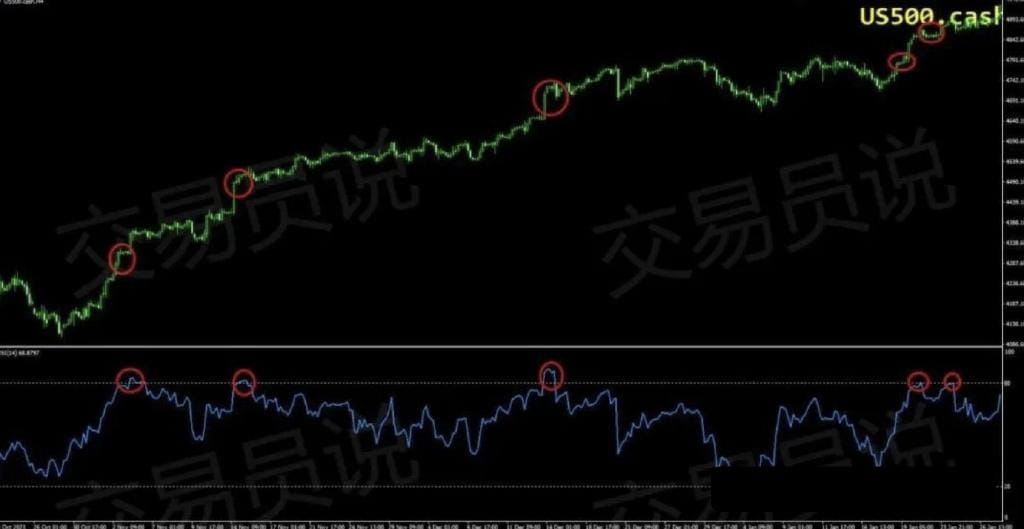
Identifying overbought and oversold conditions
One of the classic uses of RSI is identifying the market's overbought and oversold conditions. When the RSI exceeds the default threshold of 70, it indicates that an asset
may be in an overbought state, indicating potential reversals or pullbacks. Conversely, when the RSI falls below the extreme value of 30, it means an oversold state, suggesting
a potential upward reversal may occur. Traders can utilize these signals to strategically time their entries and exits.
Personally, I prefer to use more extreme levels, setting overbought conditions at 80 and oversold conditions at 20.
Important Note - Compare the extreme levels of the RSI indicator with key trading positions (such as support or resistance levels, demand or supply zones, trend lines, preferably
it's best to combine these positions from higher time frames to enhance the reliability of the signals!
Example
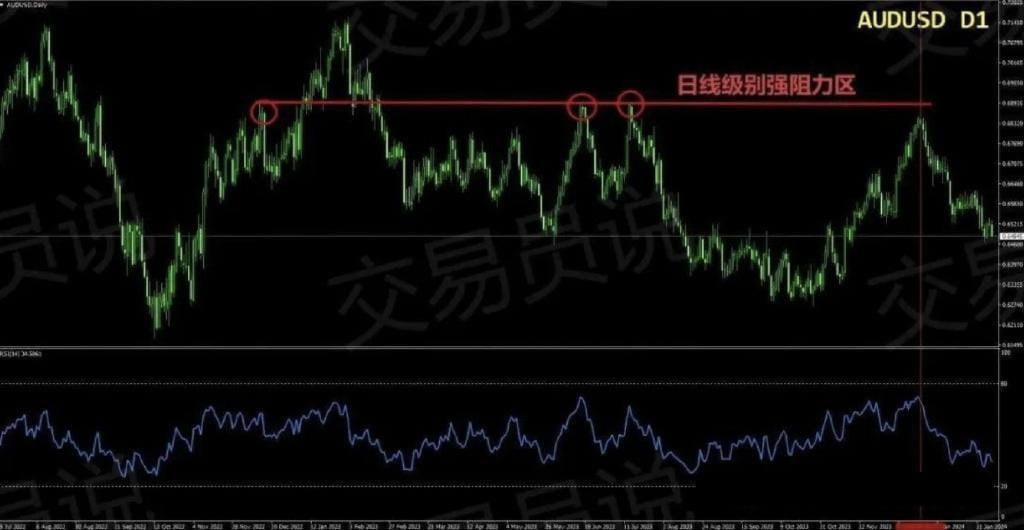
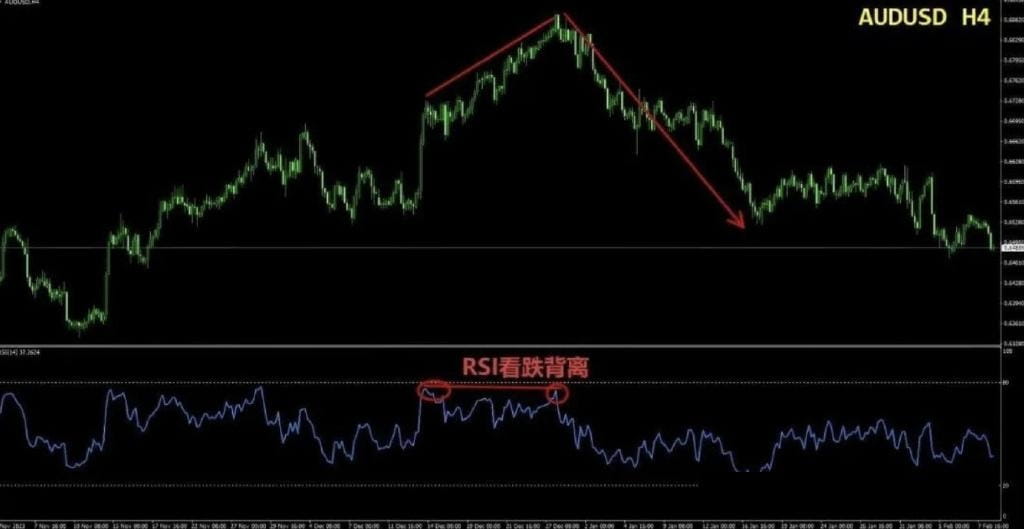
Divergence analysis
Divergence occurs when the asset price movement is inconsistent with the RSI readings. Bullish divergence occurs when the price makes new lows, but the RSI fails to do the same.
when new lows are created, indicating weakening bearish momentum. Conversely, bearish divergence occurs when price makes new highs, but the RSI fails to confirm that new high.
indicates a potential weakening of the bullish trend. Identifying divergences can provide traders with early signals of trend reversals.
Important Note - Combine divergence signals with key trading positions (such as support or resistance levels, demand or supply zones, trend lines, preferably from higher
higher time frame positions) to enhance the reliability of the signals.
Example
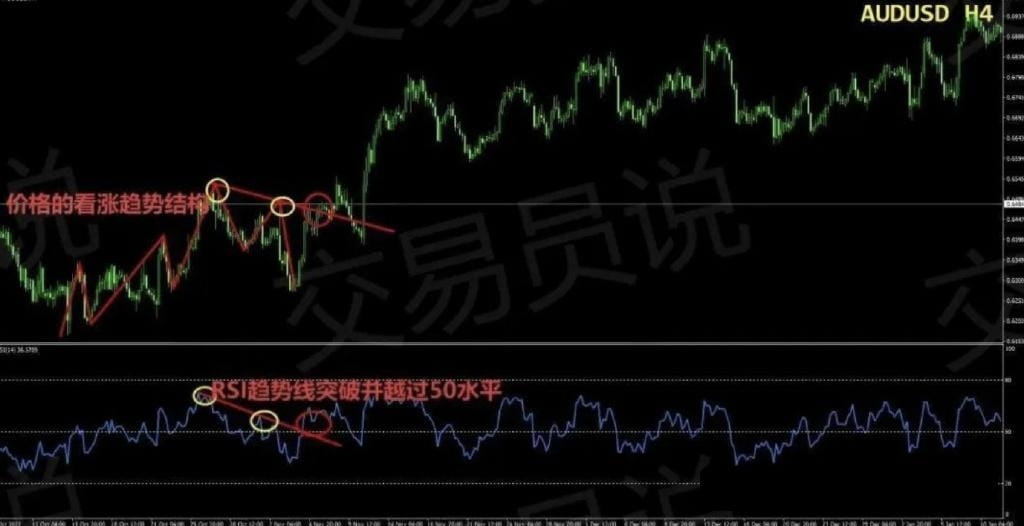
RSI trend line breakout
Drawing trend lines on the RSI chart is a powerful technique for trend analysis. When the RSI breaks above a descending trend line or falls below an ascending trend line
may indicate a potential shift in market sentiment. This approach can effectively complement traditional trend line analysis on price charts, providing
enhances traders' ability to confirm trends and reversals.
Important Note - When the RSI indicator breaks a trend line, validate the signal by confirming the RSI breaks the 50 level. Consider buying when the RSI is above 50
entry, consider selling when it is below 50.
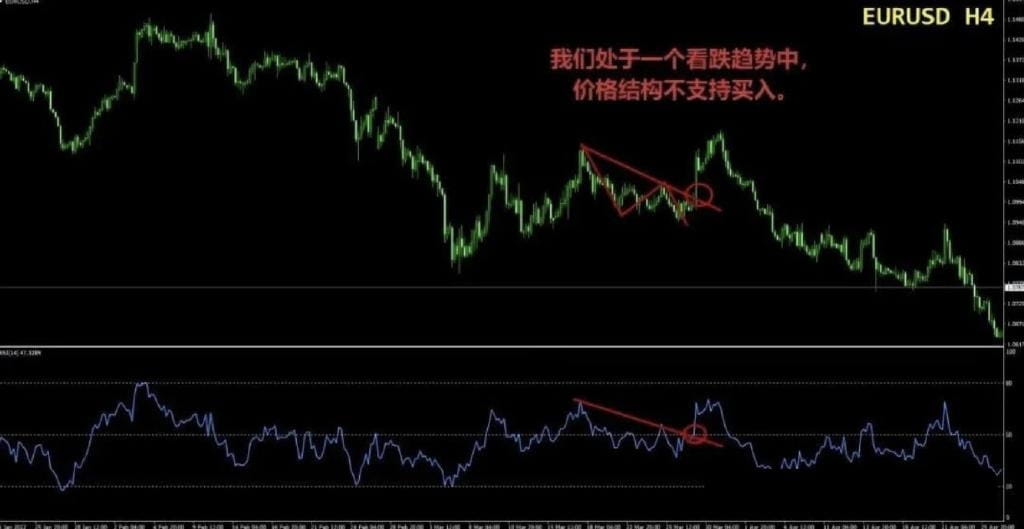
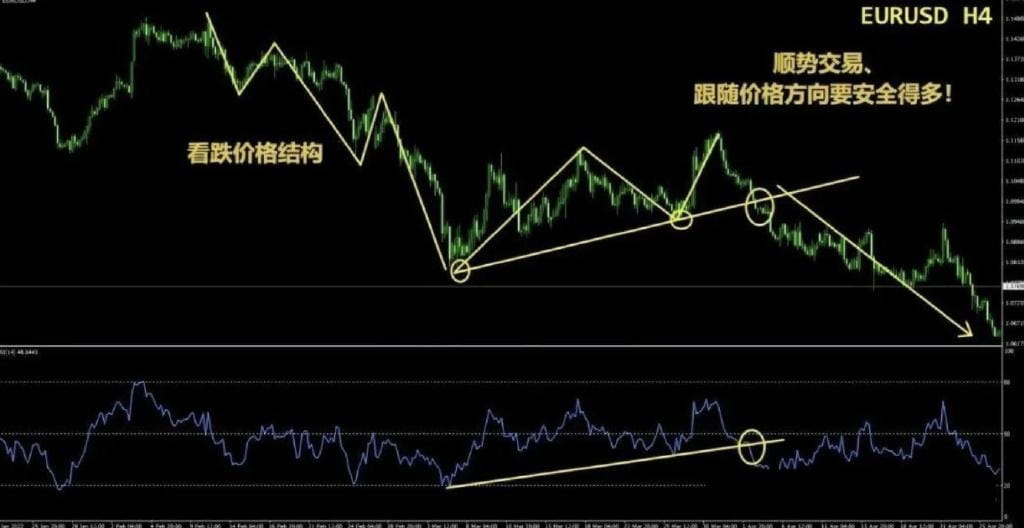
Most importantly, ensure that the structure on the price chart aligns with the direction you intend to trade. For example, if you plan to go long on a trend line breakout
and if the RSI breaks the 50 level, then confirm that the market is in an uptrend and that the price structure is bullish (higher highs and higher lows do not
consistently rise).
Example
traps to avoid
Over-reliance on extreme readings
While overbought and oversold conditions are valuable signals, relying solely on extreme RSI readings may lead to missed opportunities. During strong trends,
markets can remain overbought or oversold for extended periods. Blindly following these signals without considering other factors may lead to poor
trading decisions.
Example
Ignoring price action
The RSI is a momentum oscillator but should not be used in isolation. Traders must combine it with price action, whether the price structure is trending, support
and resistance levels, as well as other technical indicators, to validate RSI signals. Ignoring the broader market context can lead to false signals and misleading
trading strategies.
Example
Misunderstanding divergence
While divergence analysis is powerful, the key is to interpret it accurately. Traders should not rely solely on divergence signals but should combine them with other technical indicators.
or price action to confirm. Misunderstanding divergence signals may lead to premature entries or exits, resulting in potential losses.
Example
Finding balance and integrating the RSI into a comprehensive trading strategy can help traders navigate the market with more confidence and precision.
 Understanding the market clearly gives you confidence in your trades. Steady gains are far more practical than dreaming of getting rich quickly.
If you are also a technical enthusiast and are deeply researching technical operations in the crypto space, consider following @加密大师兄888 . You'll gain more insights!
