1. Dynamics of Trump's tariff policy
On Thursday evening local time, Trump signed an executive order imposing tariffs ranging from 15% to 41% on goods exported to the United States from 67 trade partners, attempting to establish a new trading system.

However, the new tariffs originally set to take effect on August 1 have been postponed to August 7. White House officials hope to reach more agreements with various countries during this period, and this week's buffer provides uncertainty for the global market while also offering space for negotiation and mediation.
For the cryptocurrency market, any fluctuations in trade policy can affect market sentiment and capital flows. Tariff policies may trigger a chain reaction in the global economic situation, which in turn could influence the price trends of cryptocurrencies like Bitcoin and Ethereum.
2. In-depth analysis of Bitcoin market trends
After the monthly line for Bitcoin closed in the red, the price began a downward trend. Yesterday we mentioned that if the upper resistance level is not broken, stop loss should be set near 117500 and initiate a short position in the trend. The market has behaved as expected, reaching around 117K, where the bears gained momentum, securing nearly 2K points in profit.
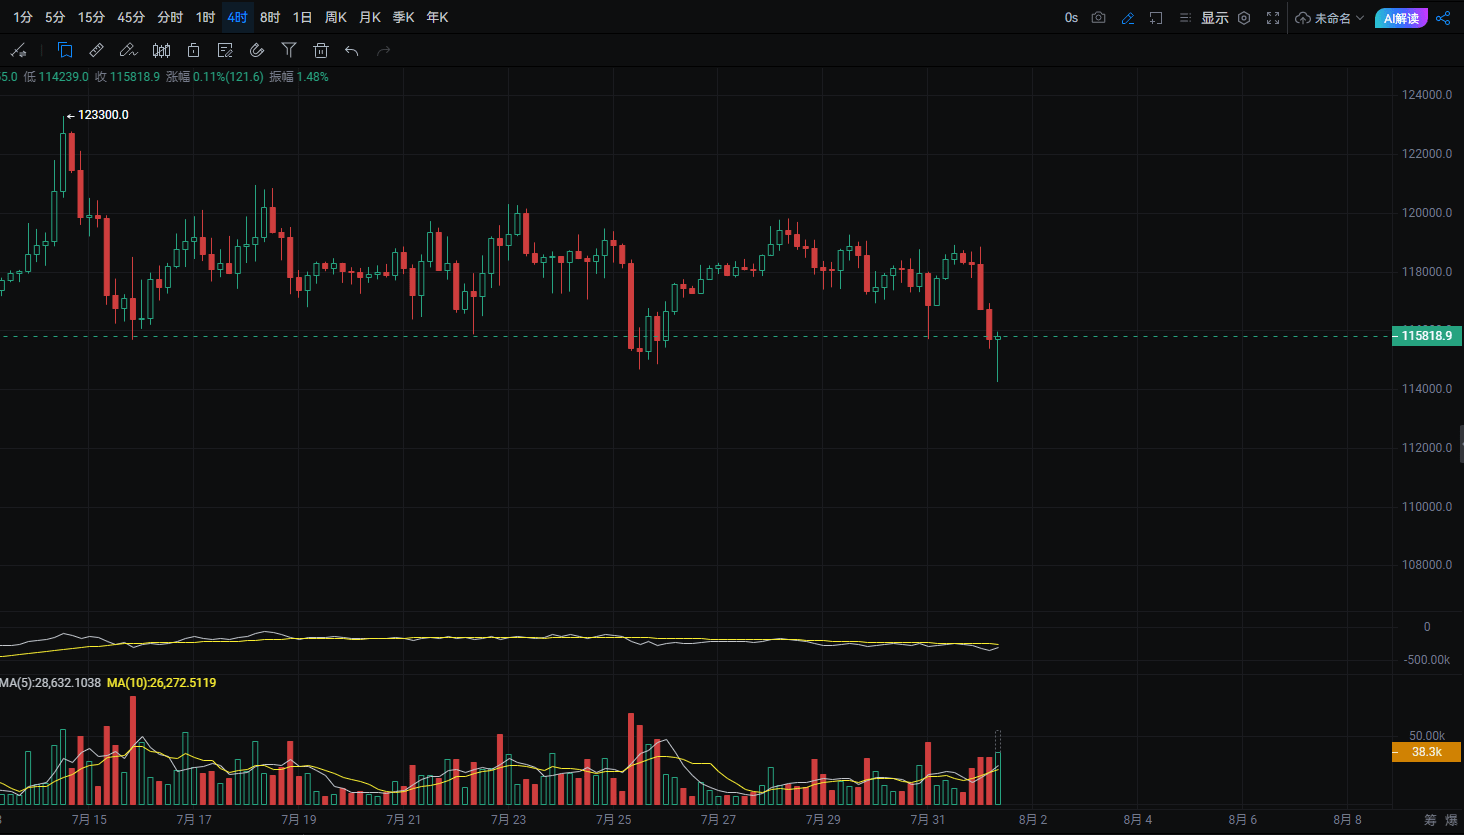
Analyzing from the 4-hour chart, the key support area below remains strong and has not been broken by the bears. Meanwhile, the TD13 indicator has sent out a strong reversal signal. Observing the RSI and KDJ indicators, both have entered the oversold range, which typically indicates excessive selling in the market in the short term, creating a demand for a rebound correction.
In summary, the trading recommendations for Bitcoin this morning are as follows: you can directly position long orders near 115K, aiming for 117K. If the price touches 117K and fails to break through effectively, you can reverse and go short. However, the market is ever-changing, and investors need to closely monitor news developments and real-time fluctuations in the market to flexibly adjust trading strategies.
3. Interpretation of Ethereum market trends
The trend of Ethereum shows a strong correlation with Bitcoin. From the 4-hour candlestick chart, it can be seen that the market has seen six consecutive bearish candles, and the current candle has a very long lower shadow, indicating strong support below during the decline. At the same time, both the KDJ and RSI indicators show signs of turning upwards, suggesting that Ethereum is likely to experience a rebound in the short term.
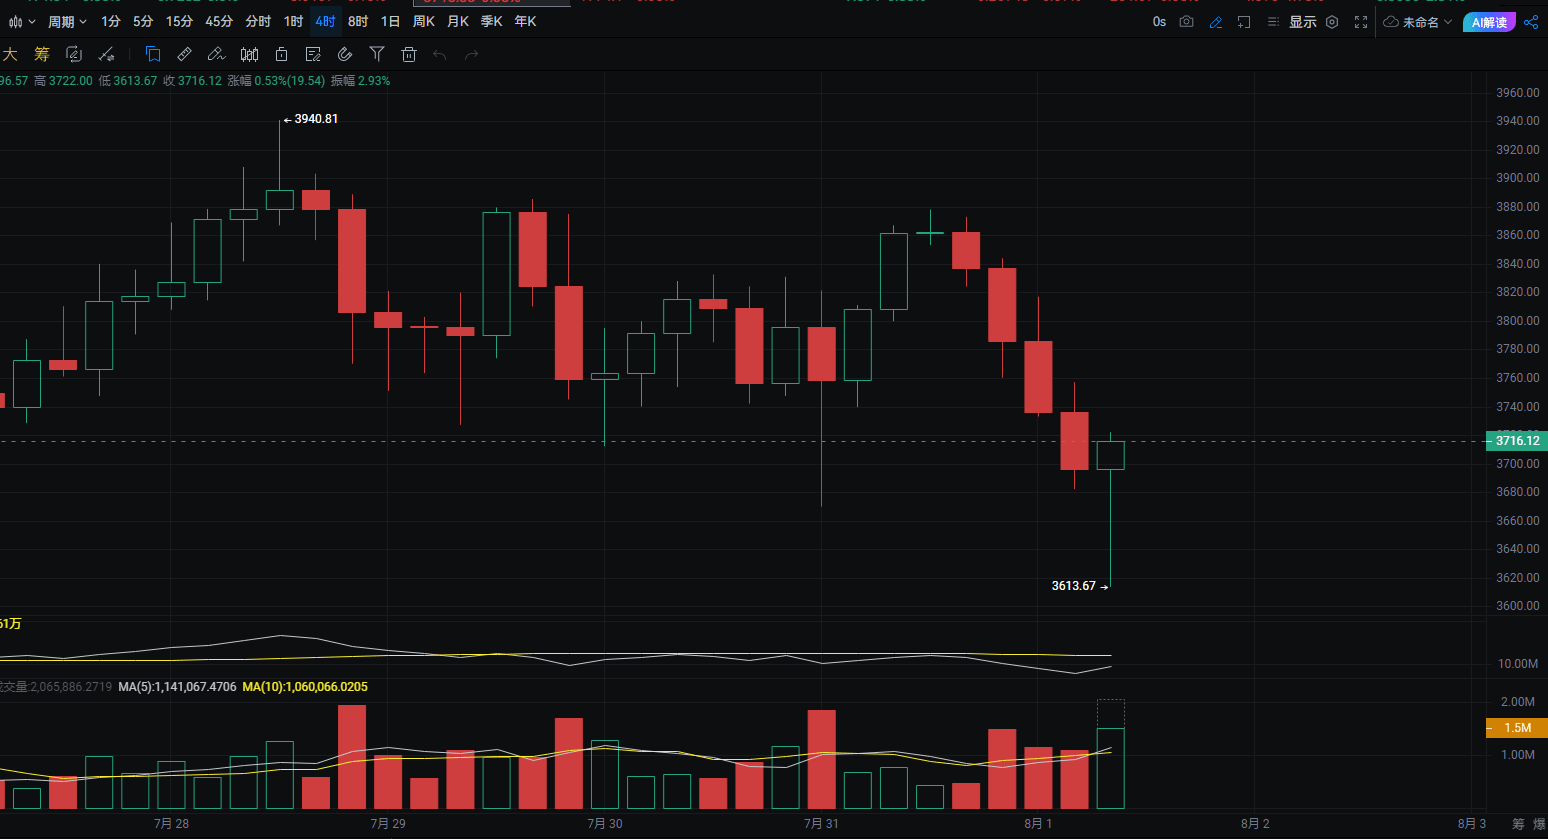
It is especially important to note that the volatility of Ethereum is higher compared to Bitcoin, leading to more drastic price fluctuations. It must be made clear that 3704 is not an absolute bottom; if the price falls below 3660, strict stop-loss strategies should be implemented to avoid greater losses. When trading Ethereum, investors should fully consider its high volatility characteristics and reasonably control their positions and risks.
I am Old Jiu from the crypto circle, follow @加密玖 ; I provide both fish and teach fishing—helping you double your investment with small amounts during a bull market, making you the sharpest knife in the market!

