At this point, the market is filled with bear and bull traps.

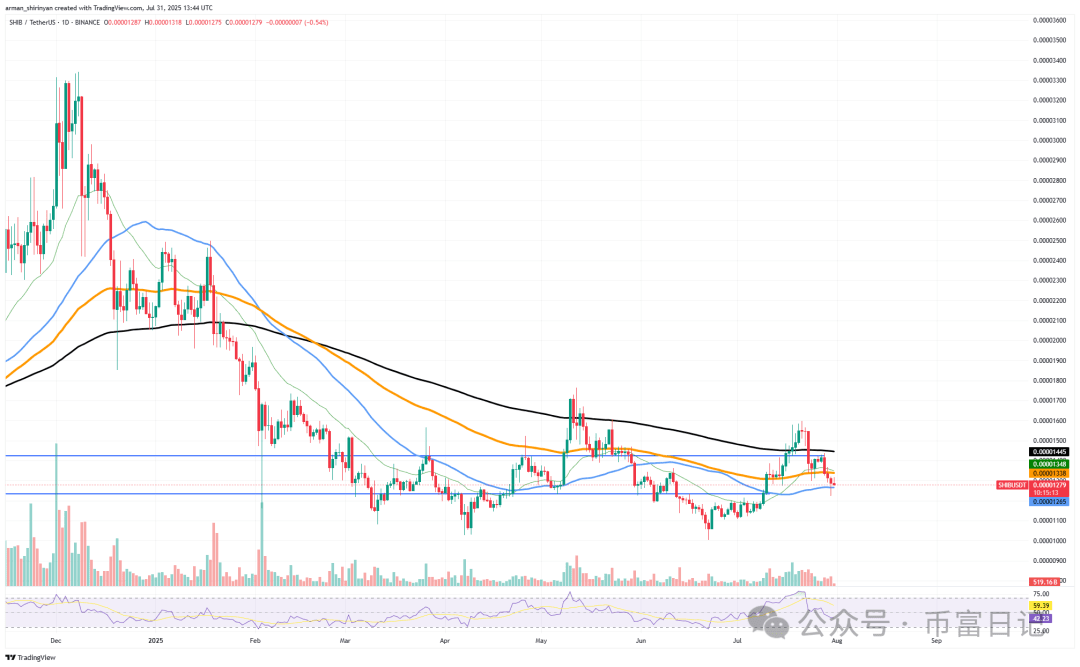
The bear trap set by Shiba Inu just shocked those who shorted this meme token. After briefly falling below the 50-day moving average, SHIB broke through the support level of $0.000012, seemingly showing a clear technical breakdown. With shrinking volume and weakening momentum indicators, bears seem to have finally taken control. Many traders may see this move as evidence of a trend reversal, but this interpretation is costly and premature.
SHIB did not continue to decline but quickly retraced its gains, reclaiming the broken support level and closing above the 50-day moving average within minutes. Later bears often panic due to this false breakout, while bulls actively adjust their positions. The subsequent price movement confirmed this hypothesis: SHIB pulled back to $0.00001305, indicating that market confidence is recovering, and with increasing volume, it may signal the beginning of a local rebound.
The mechanism of this setup points to traditional oscillation, used to clear out weak hands before the asset returns to its previous trend. This is a subtle yet effective market strategy often employed when market sentiment is unstable and liquidity is limited.
From a technical perspective, $0.00001339 and $0.00001350 are currently resistance levels for SHIB. If these resistance levels are broken, bullish momentum may reignite. On the downside, the blue trend line around $0.000012 and $0.00001256 is an important support level. As long as these levels remain intact, bears will maintain a defensive posture.
Bitcoin is ready to handle volatility.
Bitcoin's volatility is about to start contracting. After a strong rise and briefly touching nearly $119,000, the asset has entered a consolidation phase, with daily fluctuations gradually narrowing. Currently, the Bitcoin price is around $118,900, approaching the upper resistance level and forming a noticeable horizontal line below the local high.
Below the flat top, the support level of the 21-day moving average cleverly captured each dip and formed a typical rising support structure, like a pressure cooker. In the cryptocurrency world, this kind of compression is rarely permanent, especially for assets like Bitcoin.
Historically, such low volatility often signals explosive breakouts or crashes. Bitcoin's current trend includes a strong upward trend, bullish moving averages, and adequate volume support, indicating a slightly higher probability of an upward breakout.
However, it is risky for anyone to jump to conclusions here. If the closing price significantly breaks through the resistance level of $119,000-$120,000, it could immediately surge to new highs. However, if the upward trend line is broken or the breakout attempt fails, Bitcoin may pull back to test the deeper support level of $116,200, or even test the 50-day moving average support level of $111,200. The next round of movements will likely depend on a sudden increase in buying or selling volume.
XRP Stable
After weeks of fluctuations and a mid-term correction, XRP may finally stabilize, and more importantly, it may have a chance to rise steadily. The 26-day moving average (EMA) is a dynamic support level that often serves as a starting point for trend continuation during bullish periods, and the asset has just shown a noticeable rebound. After a steady pullback from the recent local high near $370, the XRP price rebounded around $3.00.
Despite some unstable daily candlestick charts, the slight bullish signal volume significantly decreased during the pullback. This indicates that this pullback was not driven by any strong selling pressure. In other words, traders are waiting and not panicking. The rebound of the 26-day moving average is particularly noteworthy. Since XRP's significant rise and breakthrough of all important moving averages in mid-July, this moving average has yet to be tested.
If the price maintains this level and continues to create higher lows in the coming days, a long-term reversal structure may be forming. This could be a continuation of the initial bullish momentum. To form this structure, XRP must gradually restore the local high point structure without triggering volatility to surge again. The initial resistance level in the short term is between $330 and $3.40.
Breaking this level may signal that bulls regain dominance and pave the way for another test of $3.70 and higher levels. Of course, this rebound still needs to be validated. If XRP cannot hold above the 26-day moving average or performs poorly in the rebound attempt, the market may revisit deeper support levels around $2.60 or even $2.30. But for now, the market pattern has already taken shape.


