Bitcoin has fluctuated around its historical highs in recent weeks but is currently not exhibiting market euphoria. There is no accelerating rise, no panic selling from short-term holders, and the urgency of stablecoin inflows is surprisingly low. This does not align with the expectations for assets rediscovering price discovery. We will analyze four high-signal indicators to assess whether Bitcoin's rise is built on shaky foundations or quietly gathering strength for the next surge.
Short-term Holder Sentiment
Short-term holders (STH) are Bitcoin investors who hold BTC for no more than 155 days. This group is the most reactive, often driven by market hype or fear. Their behavior can indicate whether the rise is gaining momentum or losing steam.
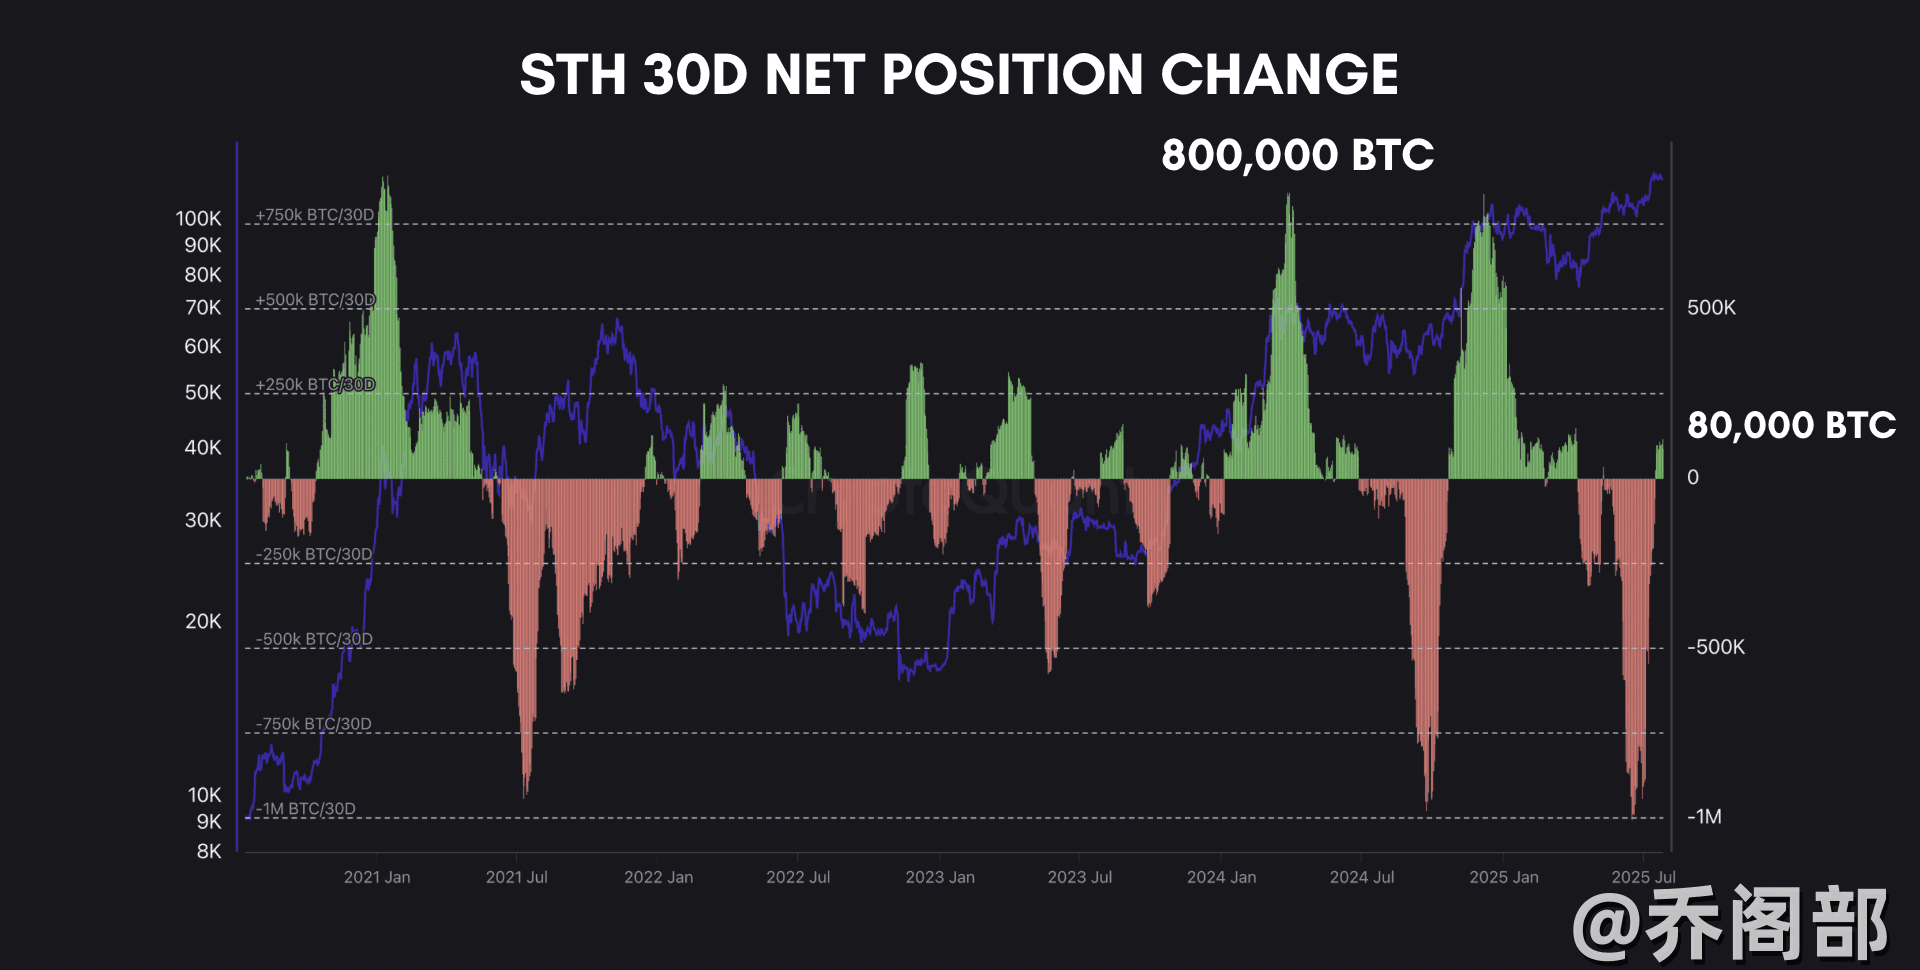
One of my favorite ways to analyze their activity is through the 30-day net position change, which tracks STH's net accumulation or distribution of Bitcoin over a rolling monthly period. This smooths out short-term noise, providing a clearer picture.
Historical data from this cycle's significant rises shows that STH net position changes typically spike sharply—reaching as high as 800,000 BTC at euphoric peaks. These surges reflect new participants flooding into the market, often marking the prelude to a correction. Conversely, a sharp drop in this metric indicates long-term holders (LTH) taking over, accumulating Bitcoin as STHs sell off.
Currently, STHs are accumulating about 80,000 BTC per month—an important figure but only about 10% of previous cycle peak levels. This discrepancy is notable. Despite Bitcoin's proximity to all-time highs, STHs have not rushed in with the same intensity. This restraint suggests that the rise has not yet become overcrowded, a situation that typically foreshadows sharp pullbacks. The mild accumulation by STHs implies that the market has not yet reached its full potential in the short to medium term.
Stablecoin Supply Ratio (SSR)
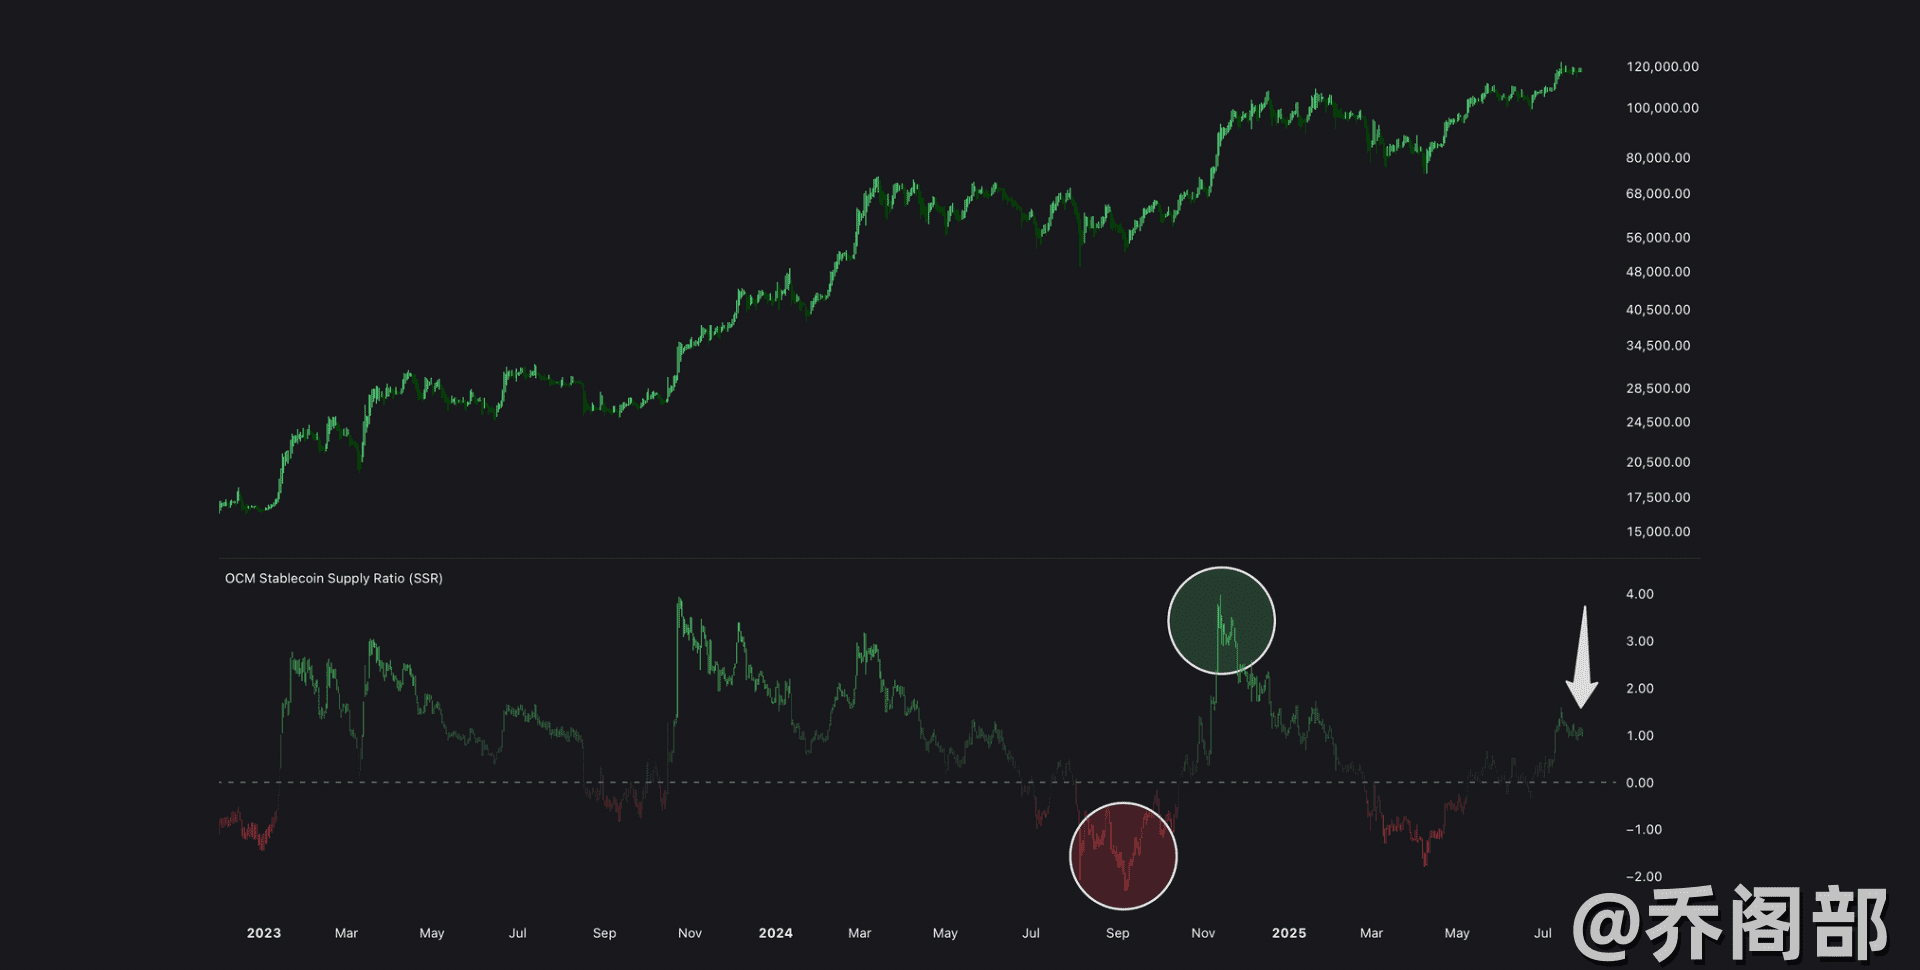
The Stablecoin Supply Ratio (SSR) is used to gauge speculative demand across the entire crypto market. It calculates the Z-score of Bitcoin's price relative to the total liquidity of all USD-pegged stablecoins over a 200-cycle window, normalizing the ratio to measure its deviation from the long-term average. Simply put, it compares Bitcoin's price to the capital in stablecoins waiting to be deployed.
High SSR (green zone): Bitcoin's price is high relative to stablecoin liquidity, indicating high speculative demand and potential overextension.
Low SSR (red zone): Ample stablecoin liquidity suggests Bitcoin is undervalued, often marking an accumulation phase or local bottom.
Currently, the SSR has just entered the green zone, which is a mild increase compared to the sharp spikes seen at previous local market tops. This is particularly noteworthy given Bitcoin's proximity to its ATH. The highest readings in the green zone typically align with overheated markets, where speculative demand far exceeds available capital. Today's mild SSR suggests that a significant amount of liquidity remains on the sidelines, ready to fuel further price increases.
30-day Price Momentum
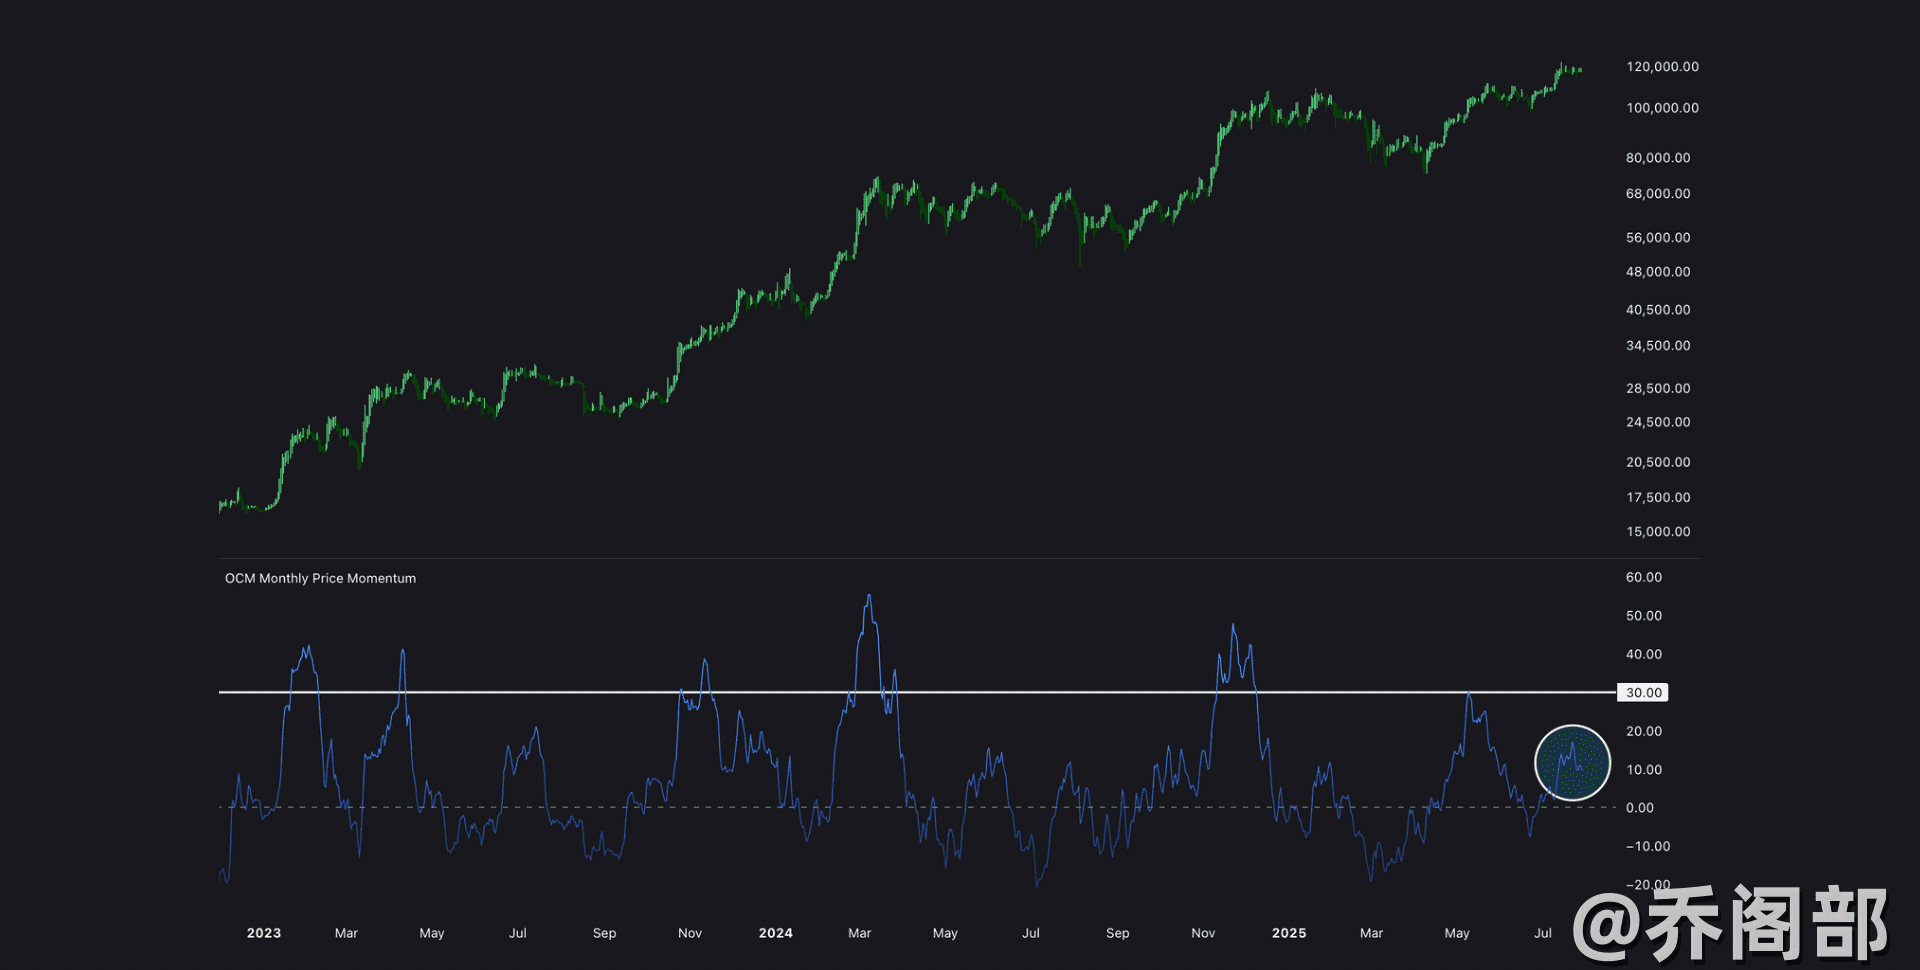
By looking at the percentage change in Bitcoin's price over the past 30 days, we can directly gauge the strength and direction of the rise. High momentum (light blue at the bottom of the chart) indicates a strong bull trend, while rapid acceleration typically signals overextension.
30% Momentum Threshold: Historically, when the 30-day momentum reaches 30%, Bitcoin typically experiences local pullbacks as rapid rises become unsustainable.
40% Momentum Threshold: Momentum exceeding 40% almost always indicates a correction, as the market becomes overheated.
Despite Bitcoin reaching new highs, its 30-day momentum is currently just above 10%. This contrasts sharply with earlier cycles when momentum often reached 30% or higher, followed by sustained months of pullbacks. This mild momentum suggests that the rise is occurring at a measured pace, far from the typically overbought conditions that indicate an impending reversal.
Momentum analysis helps us balance optimism with caution. While Bitcoin's technical price action is undoubtedly bullish, the lack of extreme momentum reduces the immediate risk of sharp pullbacks. However, this does not rule out short-term volatility—after all, it's Bitcoin. But it suggests that the rise has not yet reached the critical turning point for this cycle stage.
Bravos Fair Value Model
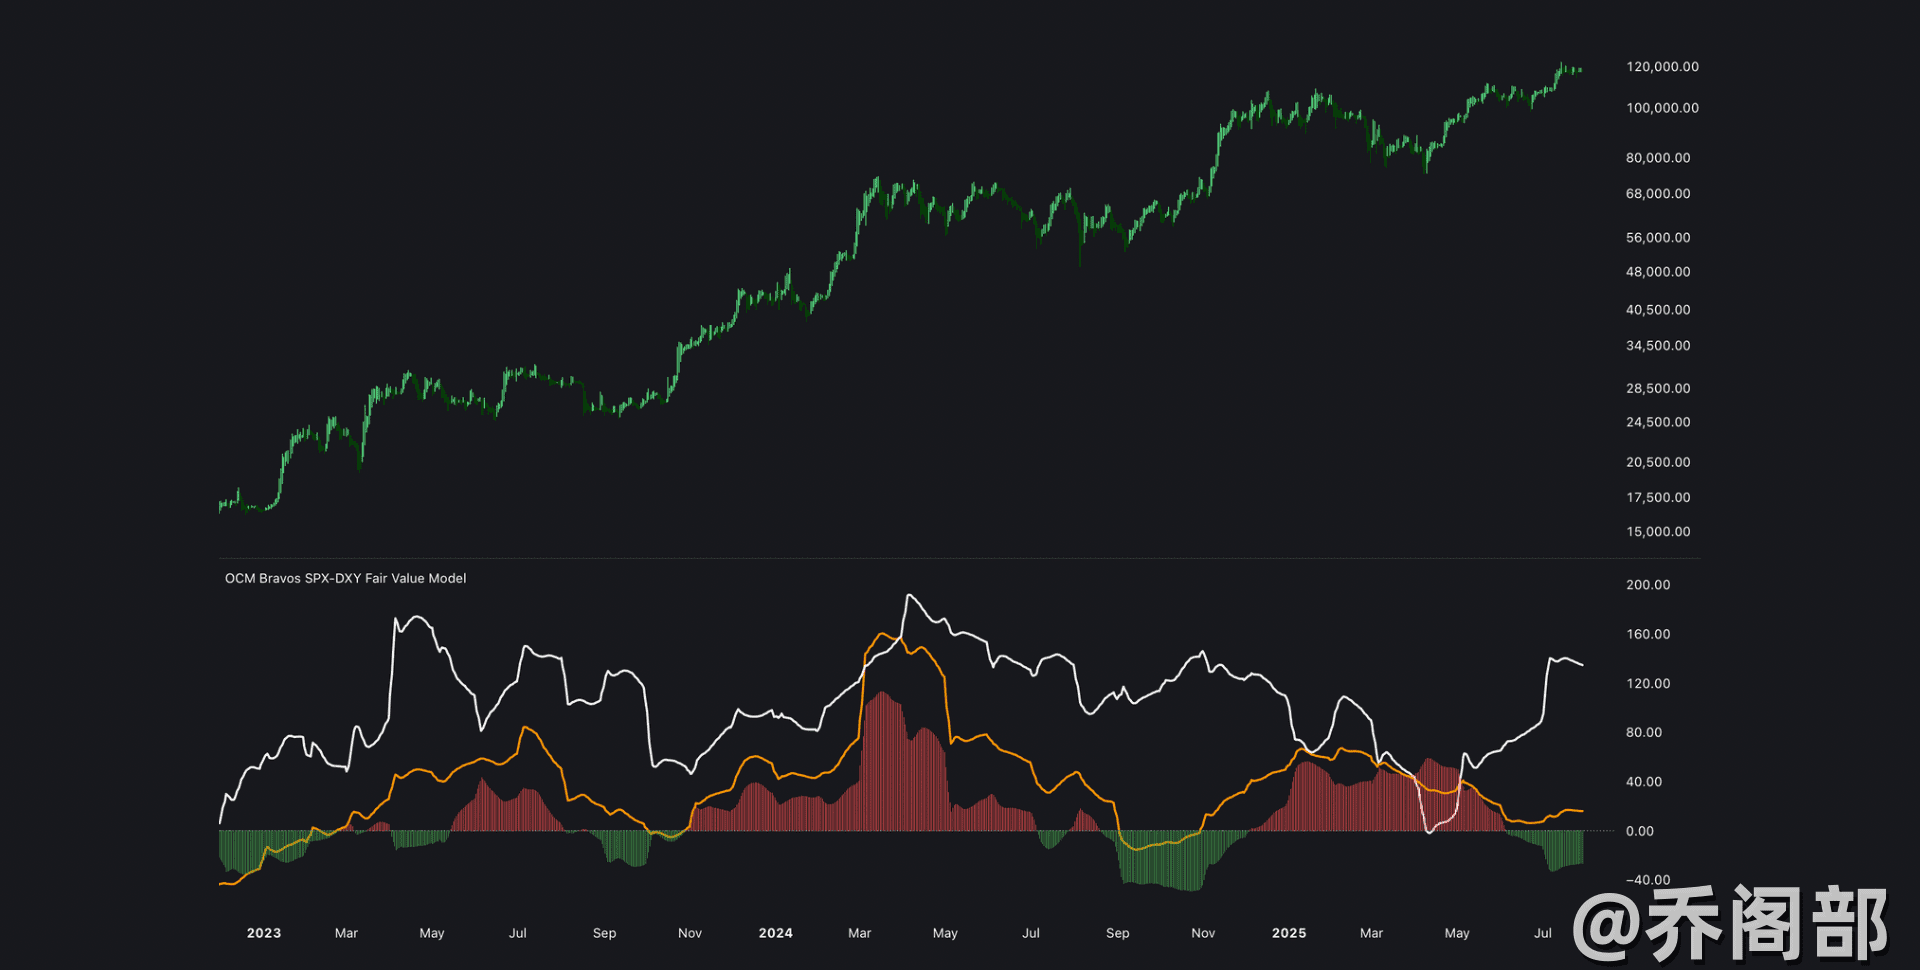
To position Bitcoin's performance within a broader financial context, I recreated an excellent fair value model inspired by Bravos Crypto Research (a great follow on YouTube, not a paid ad!). This model estimates Bitcoin's 'fair' price by comparing its 6-month returns with macroeconomic indicators, particularly a weighted combination of the US stock market and the US Dollar Index (DXY).
This model visualizes:
White Line: Normalized 6-month returns of macroeconomic indicators (stock market and DXY).
Orange Line: Actual 6-month return of Bitcoin.
My Histogram: Green indicates undervalued (Bitcoin performance below macro expectations), red indicates overvalued (Bitcoin performance above macro expectations)
Currently, the model shows a green histogram, indicating that Bitcoin is trading below its fair value relative to macro conditions. This undervaluation is a very significant finding. The green peaks of this cycle foreshadow the exciting rises we've experienced, and I believe this theory will continue to hold as long as the macro backdrop remains supportive. Given the strong performance of risk assets like the stock market and the relative stability of the dollar, the macro environment favors Bitcoin's growth in the next six months.