1. Cryptocurrency Fear Index Crypto Fear & Greed Index
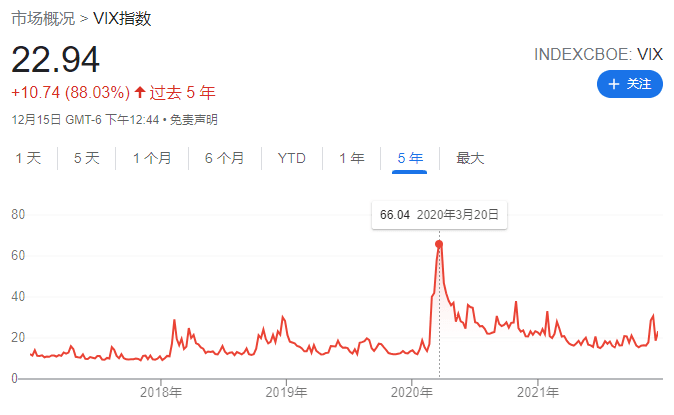
In traditional financial markets, there is a fear index called VIX (as shown in the image above), where higher values indicate more panic. On March 20, 2020, it reached a maximum value of 66, and recently on December 3, it reached a relatively high value of 31. You can check the corresponding S&P curve to get a sense of what to do during these days. The VIX index usually stays below 20 and has little reference value for market tops, but it does have some value for short-term bottom fishing.
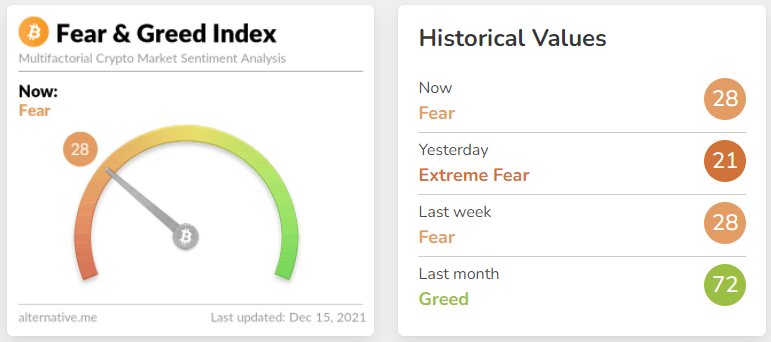
There is a similar fear index in the cryptocurrency space, ranging from 0 to 100, indicating from extreme fear to extreme greed, updated every morning at 8 AM. If you don't feel much from just looking at the value, let's take a look at the historical curve chart:
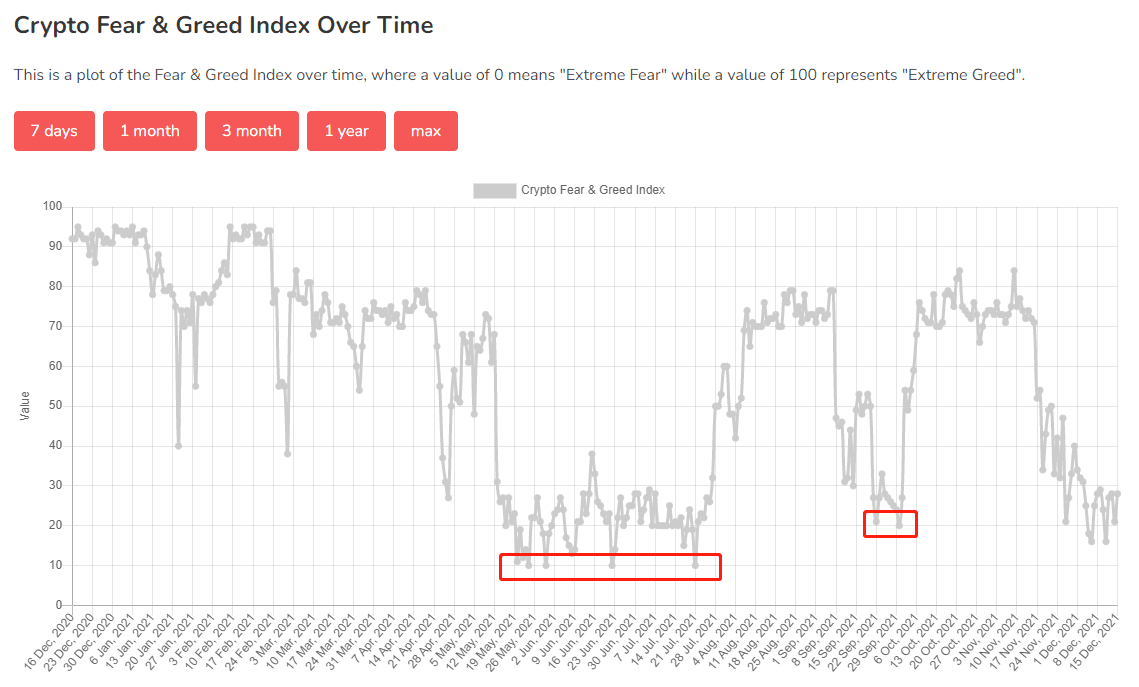
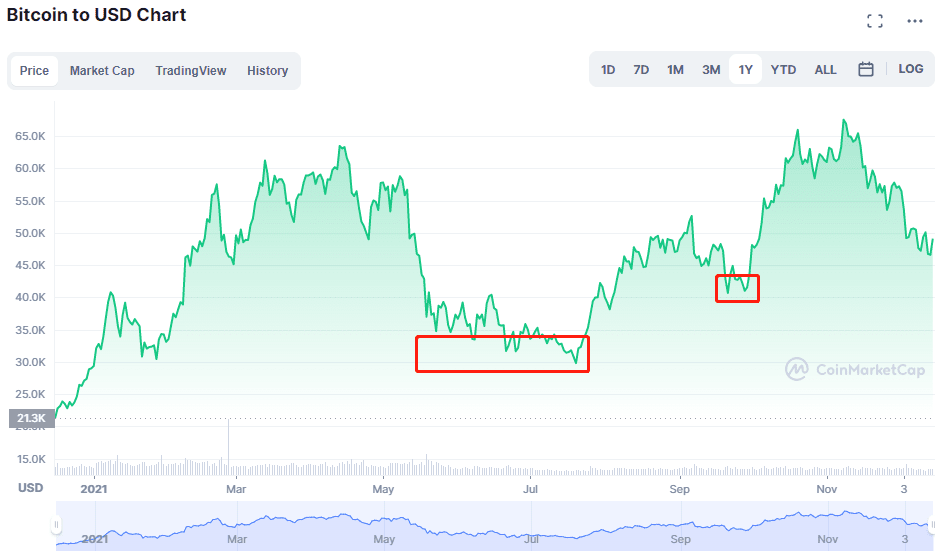
The correlation is obvious. There is also no guiding significance for market tops, but it can be referenced for short-term buying operations. Everything is about probability; no indicator is 100% accurate, especially when too many people believe in an indicator, it becomes ineffective because there is no counterparty.
2. Attention on CoinMarketCap platform 'Watchlists'
CoinMarketCap is one of the most frequently used websites by cryptocurrency enthusiasts, as it provides comprehensive data. There is an indicator called 'watchlists', which represents the number of users following a specific cryptocurrency. When a user clicks the star to follow that cryptocurrency, the value increases by 1. This value can be used to roughly assess the consensus, popularity, and heat of a cryptocurrency. By analyzing the growth based on the timeline, it can also evaluate the growth potential and future expectations of the cryptocurrency.
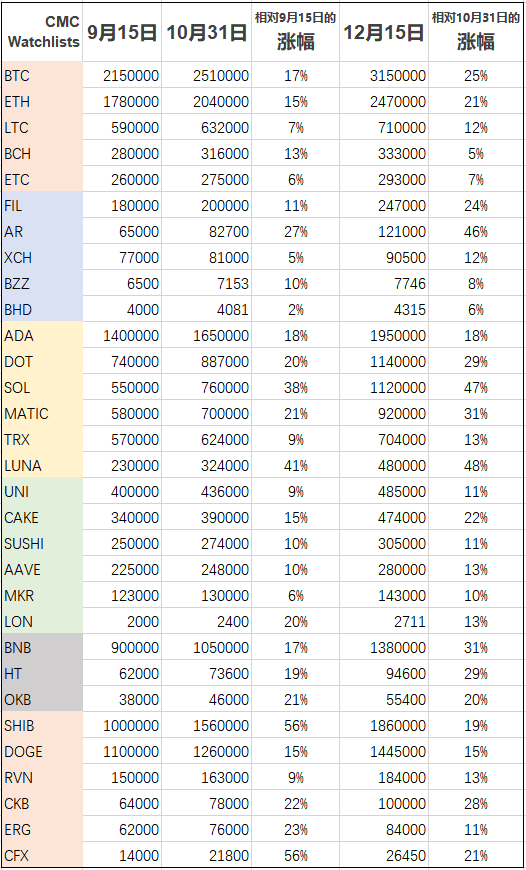
The values have been appropriately rounded for easier comparison.
For example, looking at absolute attention numbers, Bitcoin is still the big brother, and Ethereum is the second brother, with over a million being considered mainstream coins. Observing the growth values from the two occasions, notable performers include SOL, LUNA, AR, MATIC, DOT, etc. Particularly, those with a small attention base but large growth are worth focusing on; a low base means greater elasticity. The price performance of these coins is also commendable, showing some correlation. Partners can continue to keep records or select their favorite cryptocurrencies for regular recording, which will be meaningful. Big data is always more reliable than blind faith.
3. Market Value to Realized Value (The ratio of market value to realized value)
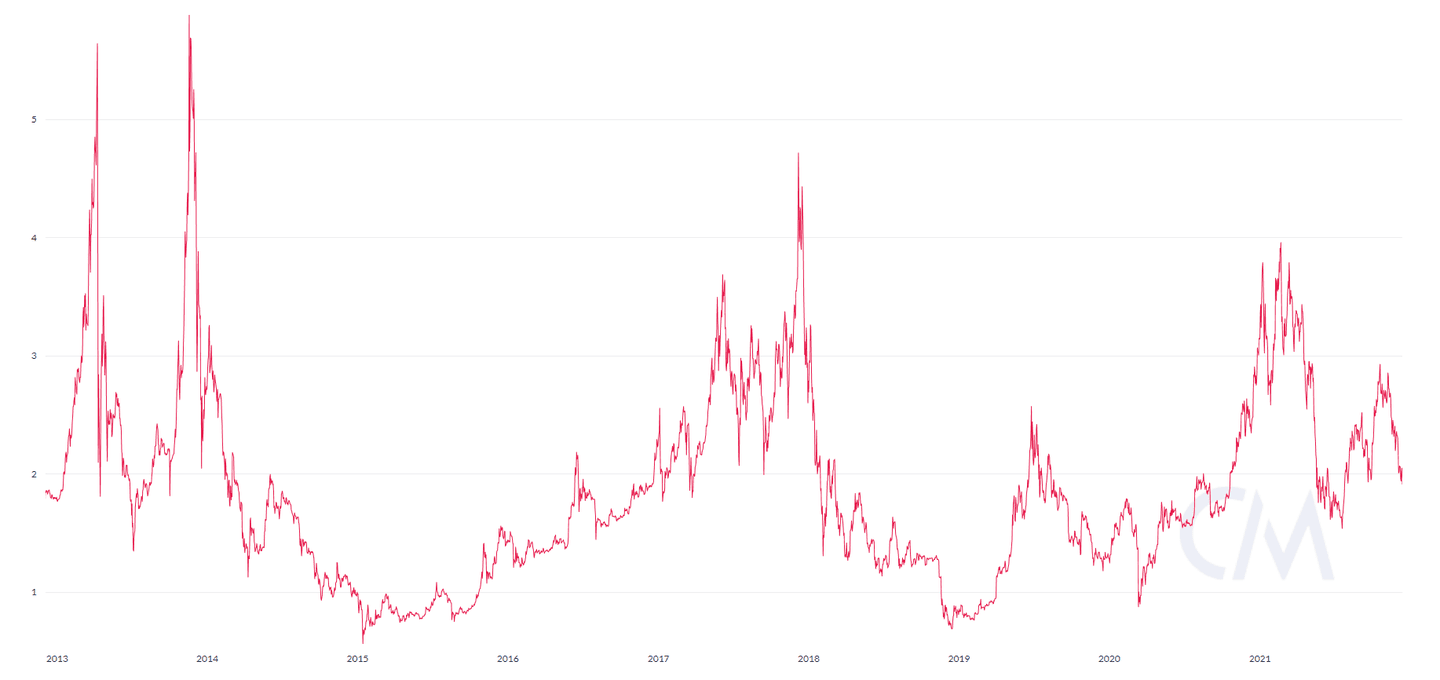
The MVRV historical curve from 2013 to 2021, it is recommended to click to enlarge for viewing.
Abbreviated as: MVRV, this is an indicator promoted by Coin Metrics. This indicator is derived from the market value of freely circulating Bitcoin (the amount of currency circulating in the past five years) compared to its 'realized value' (the total price of each Bitcoin during its last on-chain circulation). When the realized value soars, the market value can remain unchanged, and vice versa. One is a 'snapshot' of Bitcoin's current price, while the other is a dynamic measurement indicator with added flow.
Extreme deviations between market value and realized value can be used to identify market tops and bottoms, reflecting periods of extreme unrealized profits and losses for investors. Note that this indicator only samples Bitcoin! From several major historical cycles, we can see that above 3 is the top area and below 1 is the bottom area. In April of this year, the first peak nearly reached 4, while the recent peak in November was only close to 3, indicating that the bubble at the second peak was not as large as at the first peak. Looking back at the peak in December 2017, the indicator was close to 5, and during the double top in 2013, it broke through 5. This suggests that with a large influx of new institutional and user funds participating, Bitcoin's price continues to reach new highs, but the bubbles are getting smaller. Therefore, we can no longer judge tops and bottoms based on the 'absolute value of the price', but can only rely on big data indicators. I believe MVRV is definitely one of them.
4. Exchange Balances
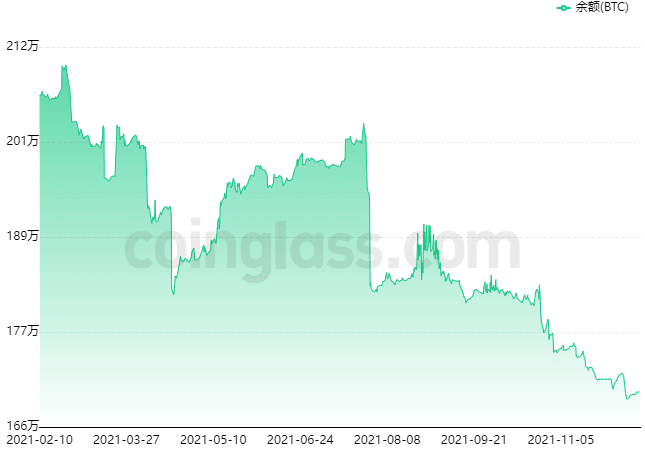
Exchange balances are one of the most mentioned indicators by media and influencers, and I believe it is also one of the most misunderstood indicators. I never think that exchange balances have any reference value. Comparing the trend in the above image, is there any correlation? Clearly, there isn't! If someone wants to sell coins, it only takes about 1-2 hours to transfer from a wallet to an exchange; there's no need to keep it in the exchange balance for a long time. It's very convenient to transfer it back in when needed. Moreover, there are now many DEX decentralized exchanges, where a thought and a few clicks can complete the transaction, and the central exchange balances show increasingly poor correlation with trends. Furthermore, to make the balance curve more pronounced, the Y-axis value starts directly from 1.66 million. If we start the chart from zero, this curve would likely look more like sideways consolidation.
In summary, all indicators are just probabilistic references and do not guarantee 100% results. However, since cryptocurrencies operate on the chain with transparent data, we can more easily obtain some trend-based big data as a reference compared to traditional financial markets, which can rival institutional data.
If you are also a tech enthusiast and are deeply researching the technical operations in the cryptocurrency space, consider following @加密大师兄888 for more insights!