If your funds are within 50,000, and you want to quickly succeed in the crypto world through short-term trading, then please read this post carefully. After reading it, I believe you will have a sudden understanding of the essence of short-term trading!
I was born in 1987 and have been in the crypto world for 11 years. I have been trading cryptocurrencies full-time to support my family for 5 years!
Not choosing a major in finance or computer science in college is one of the biggest regrets of my life. I started to come into contact with Bitcoin and blockchain online very early, and the magical K-line chart and subversive concepts fascinated me. With unlimited longing for the crypto world, I participated in trading early on, and since then I have started this journey full of challenges and opportunities.
Like most friends who have just entered the circle, at the beginning, I would be fascinated by various technical indicators and on-chain data, constantly backtesting and trying to find the "holy grail"; I was keen on bottom-fishing "low-priced" altcoins, or those "value coins" that had already fallen by 90%+, thinking that their "safety margin" was higher. The cruel reality told me that most of these initial understandings of the market are wrong and dangerous.
Later, I realized deeply: If you want to obtain income quickly and relatively controllably in the crypto world, which is highly volatile and operates 24/7, focusing on short-term hot trend is almost the only feasible path (for small funds). The core of short-term trading lies in identifying the mainstream narrative track of the market and accurately grasping the emotional cycle*. The mainstream narrative breeds leading currencies, and the crazy rise of the leading currencies in turn strengthens and spreads the narrative. And the one that contributes the most and is most efficient to your account is often to catch the leading currencies in those stages*. In a violent bull market, they provide the strongest explosive power; in a partial rebound, they often start first and are relatively "resistant to falling" (note: the "safety" of the crypto world is relative!). In 2021, I also captured the most rapid main rising wave of my career on leading tracks such as SOL and MATIC.**
The same coin, bought in different market sentiment stages and narrative cycles, will have completely different results! The emotional cycle tells you: when you can be bold and even use leverage (be careful!); when you must control your hands and even go short (if you have the ability); when you should leave the market completely and wait and see. The mainstream narrative of the market tells you which direction the funds are attacking (is it AI, MEME, new public chain, or Layer2?). This is the correct top-down speculative thinking. Unfortunately, many friends completely reverse it, go against the trend, and fight against market sentiment, and the result is naturally ruthlessly harvested.
A sentence impressed me deeply: "The cognitive highlands of the mind, if you don't occupy them, FUD (fear, uncertainty, doubt) and FOMO (fear of missing out) will occupy them."
Today, I am sharing with you this set of short-term survival and attack tactics in the crypto world, which supports me to survive and continuously profit in this market that is bloodier, faster, and more unpredictable than the stock market. If you can calm down and understand, practice, and finally internalize it, your understanding of "crypto trading" will definitely undergo earth-shaking changes!
Follow Bitcoin's Ups and Downs Closely
Bitcoin is the weather vane of the crypto world, and the rise and fall of most small currencies are affected by it. Currencies with a stronger concept logic, such as Ethereum, will occasionally deviate from Bitcoin and walk out of a unilateral market, but other altcoins can hardly escape Bitcoin's "control." Therefore, paying close attention to the trading rise and fall of Bitcoin can provide us with an important reference for trading other currencies.
Seize the Golden Trading Moment
Every day from 24:00 to 1:00 the next day is a special period for crypto trading, and the "golden light" phenomenon is prone to occur. This is the trading volume period in most parts of the world, and all kinds of unexpected situations can occur. Friends who want to buy at a low price or sell at a high price can place a super low-price buy order or an ideal lie-down-and-earn price sell order before going to bed, and maybe they can be lucky enough to complete the transaction.
Pay attention to the price trend of USDT
Under normal circumstances, USDT and Bitcoin move in opposite directions. When you find that USDT is rising rapidly, you must be alert to the sharp drop in Bitcoin as soon as possible; and when Bitcoin rises, it is often the golden low point for buying USDT. By grasping the relationship between the price trends of the two, you can make better trading decisions.
Pay attention to the financial news of central banks around the world
The volatility of the crypto world is deeply affected by the attitudes of governments around the world towards Bitcoin. If the government takes strike or control measures, the market will likely fall. In addition, changes in US financial policies, such as the recent rumors of taxing the rich, will also have a major impact on the crypto world. Therefore, paying attention to the financial news of central banks around the world every day is an essential task for crypto traders.
Grasp the Key Time Period
Every morning from 6 am to 8 am is a critical period for determining when to buy or sell, and it can also be used to judge the upward or downward trend of the day. If it has been falling from 0 am to 6 am and is still falling during this period, then this is a good time to buy or add to your position, and the probability of rising that day is high; if it has been rising from 0 am to 6 am and is still rising during this period, then this is a selling opportunity, and the probability of falling that day is high.
Pay attention to "Black Friday"
There is a saying in the crypto world that "Black Friday" occurs, and there are more cases of sharp declines on Fridays, but there are also times when it is sideways or rises sharply. Although it is not particularly accurate, it is still necessary to pay a little attention to the news.
Pay attention to trading volume
Trading volume is the lifeline of digital currency. For cryptocurrencies with a certain amount of trading guarantee, if the price falls, don't worry too much, and hold patiently, and the probability of recovering the capital is high. It may be a week in the short term, and it may be a month in the long term. If you have spare money, you can buy in batches to reduce the average cost, so that the capital will be recovered faster; if you don't have spare money, then wait patiently, and it will not disappoint.
Avoid frequent trading
For the same cryptocurrency, holding spot purchases and sales for a long time is usually more profitable than frequent trading, which greatly tests the patience of investors. Frequent trading may not only increase transaction costs, but also easily lead to wrong decisions due to emotional fluctuations.
Application of K-line moving average
In crypto trading, K-line theory has some applicability, but not all indicator analysis is useful. Although the accuracy of K-line technology is not 100%, and many people feel that it is not very useful after learning it, in fact, according to the experience of many experts, K-line technology plays a key role in analyzing the long-term trend of coin prices. No matter where the coin price goes, it will be reflected in the transaction, and we can use these techniques to understand the trend of the coin price.
Moving Average Law: Building a Trend Framework
In the trend cycle of the 1-hour chart, we can use three EMA moving averages to build a trend framework: the fast line 21 represents short-term momentum, the middle line 55 reflects the medium-term direction, and the slow line 144 defines the long-term trend. When the moving averages show a bullish arrangement of "fast line > middle line > slow line", the market is in a strong upward cycle; otherwise, the market is dominated by bears. This combination can effectively filter out noise. Even if the moving averages turn their heads, as long as the order of arrangement does not change, the trend direction is still valid.
However, the moving average has the drawback of being lagging. We can make up for this through the "trend K-line confirmation" mechanism: After the price breaks through the moving average arrangement, wait for a 15-minute chart to show a K-line in the same direction (such as a big positive line in a bullish trend) before entering the market. This can avoid false breakthroughs and capture the trend acceleration phase. The parameter selection also has its logic: 21 cycles correspond to monthly fluctuations, 55 cycles match quarterly trends, and 144 cycles resonate with annual lines. In historical backtests of foreign exchange, futures, and other varieties, the winning rate is stable above 65%, and the profit-loss ratio is 1:2.3.
The support and pressure of moving averages
Moving averages with important parameters have support and pressure effects. When the market tests the moving average with important parameters from bottom to top, the market will be under pressure and there is an expectation of a callback or reversal to the downside; when the market tests the moving average with important parameters from top to bottom, the market will get support and there is an expectation of a callback or reversal to the upside. In actual combat, we can choose these moving averages with important parameters and combine some reversal structures or patterns to trade.
For example, in the ETH/USDT1 hour chart in May 2024, EMA21/55/144 shows a bullish arrangement, but the price has retraced the 55 moving average 3 times without breaking. At this time, observe the 15-minute chart and find that each retracement is accompanied by a shrinking trading volume and a doji star pattern, which is a typical "trend continuation signal." Eventually, ETH broke through the previous high, with a single wave increase of 37%.
Moving Average Crossover to Judge Trends and Entry Timing
The crossover of moving averages is also a commonly used analysis method. Add two moving averages to the chart, the one with the smaller parameter is the fast line, which changes quickly; the one with the larger parameter is the slow line, which changes slowly. There are two main uses of moving average crossovers: one is to judge the direction, the slow line crossing the fast line upwards is the standard for confirming a bullish trend; the slow line crossing the fast line downwards is the standard for confirming a bearish trend. The second is to determine the entry signal, the slow line crossing the fast line upwards is the signal to enter a long position; the slow line crossing the fast line downwards is the signal to enter a short position.
For example, in the 1-hour level K-line chart of a certain spot gold, after the K-line crosses below the moving average, it is judged that the trend is bearish, wait for the K-line to retrace the moving average to get pressure and fail to break, and then break the previous low point again to enter a short position, and the stop loss is set at the high point of the callback. After the first order enters the market, the market retraces the moving average again after a period of decline, gets pressure, and after the second break of the low, you can enter the market again to add to the position.
Combining Moving Averages with Other Indicators
Moving averages can be used in conjunction with indicators such as Fibonacci retracement and MACD to improve the accuracy of trading decisions. For example, after the moving average golden cross or death cross confirms the direction, the market has usually run for a period of space. At this time, the profit-loss ratio of entering the market may be unreasonable. Combine the Fibonacci retracement to find the key position of the trend callback before entering the market, the stop-loss space is smaller, and the profit-loss ratio is more reasonable.
For example, when the market tests the moving average and there is an expectation of a reversal, if the MACD also shows a divergence pattern, it forms a resonance of the market reversal. You can combine the small-level moving average to enter the market, so that the stop-loss space is small. If the market comes out, the profit-loss ratio will be ideal.
Trading is a long-term practice. If you want to gain something in the crypto world, you must abide by the rules and build your own trading system. I hope this crypto trading strategy can provide useful references for everyone's trading in the crypto world, and I wish everyone can achieve ideal returns.
The point is here! Next, I will share with you the application of K-line moving average. We all know the importance of K-line in the stock market.
So in the currency circle, these K-line theories are only applicable to some parts of the currency circle, and not all indicator analysis is
Use, although the accuracy of K-line technology is not 100%, and even many K-line knowledge we feel after learning is not useful
big, in fact, according to the experience of many experts, K-line technology still plays a key role in the long-term analysis of coin prices.
Whether the coin price is going to go in which direction, it will be reflected in the transaction. We can use these techniques to understand
The trend of the coin price, the K-line tells the probability, and guides you on a bright path when you are confused.
Without further ado, let's get to the point.
Today's main basic indicator tactics:
1. Moving Average Usage and Settings
2. RSI Indicator + Usage 3 Value Investing
1. How to use moving averages to judge the trend
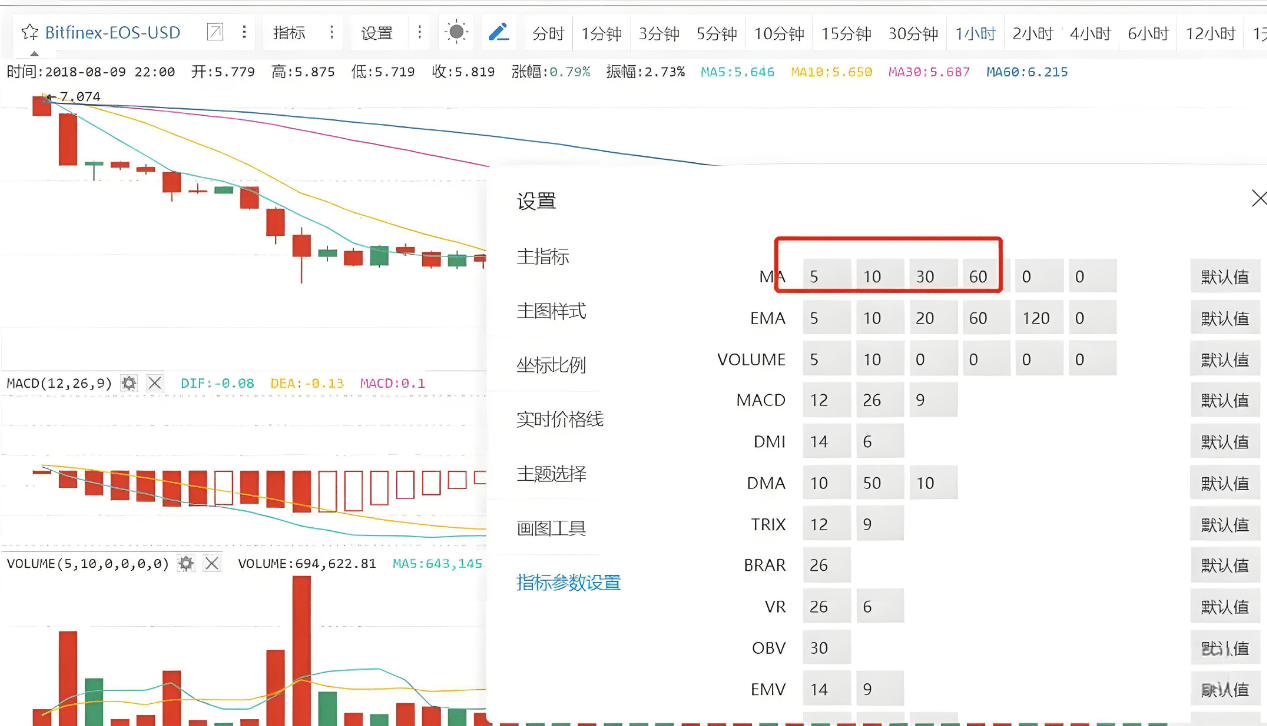
1. First, let's learn how to set up indicators
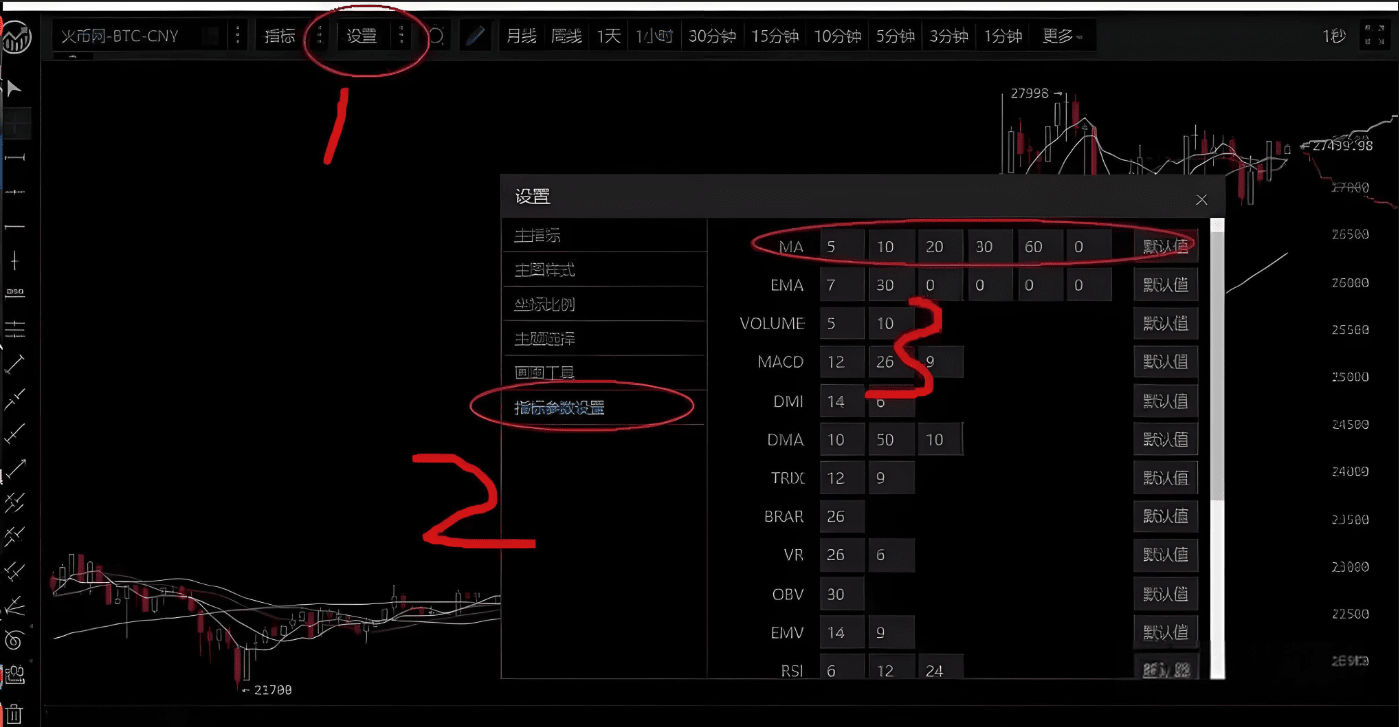
Because the Huobi website has some updates, if friends can't find it, you can directly click on the line with the mouse.
You can see these lines, just click on the line to change them.
After opening it, change it directly here. First, the moving averages we need to use are: 5-day moving average, 30-day moving average, 60-day moving average, 120-day moving average, such as
If you feel it is not easy to use, you can even change the 5-day moving average to a 4-day moving average, and the market will react more sensitively.
2. Short-term Moving Average Indicators: 5-day Moving Average Trading Strategy.
The 5-day moving average is commonly used for short-term trading. What is the 5-day moving average? The 5-day moving average is the sum of the closing prices of five days divided by five. Generally, the system is set to...
Weekly line, to put it bluntly, is also based on the average price of a week as the moving average, but a week is too long, and the reflection is relatively slow, of course, there are also
The 4-day moving average used by experts, etc., can be visually displayed through settings. The 5-day moving average is the most practical for short-term judgment.
The 5-day moving average also represents the position price of everyone within five days, representing the buying and selling signs within five days, which is the range that everyone can psychologically bear.
range, the average cost of holding positions. Then the same is true if the moving average is changed.
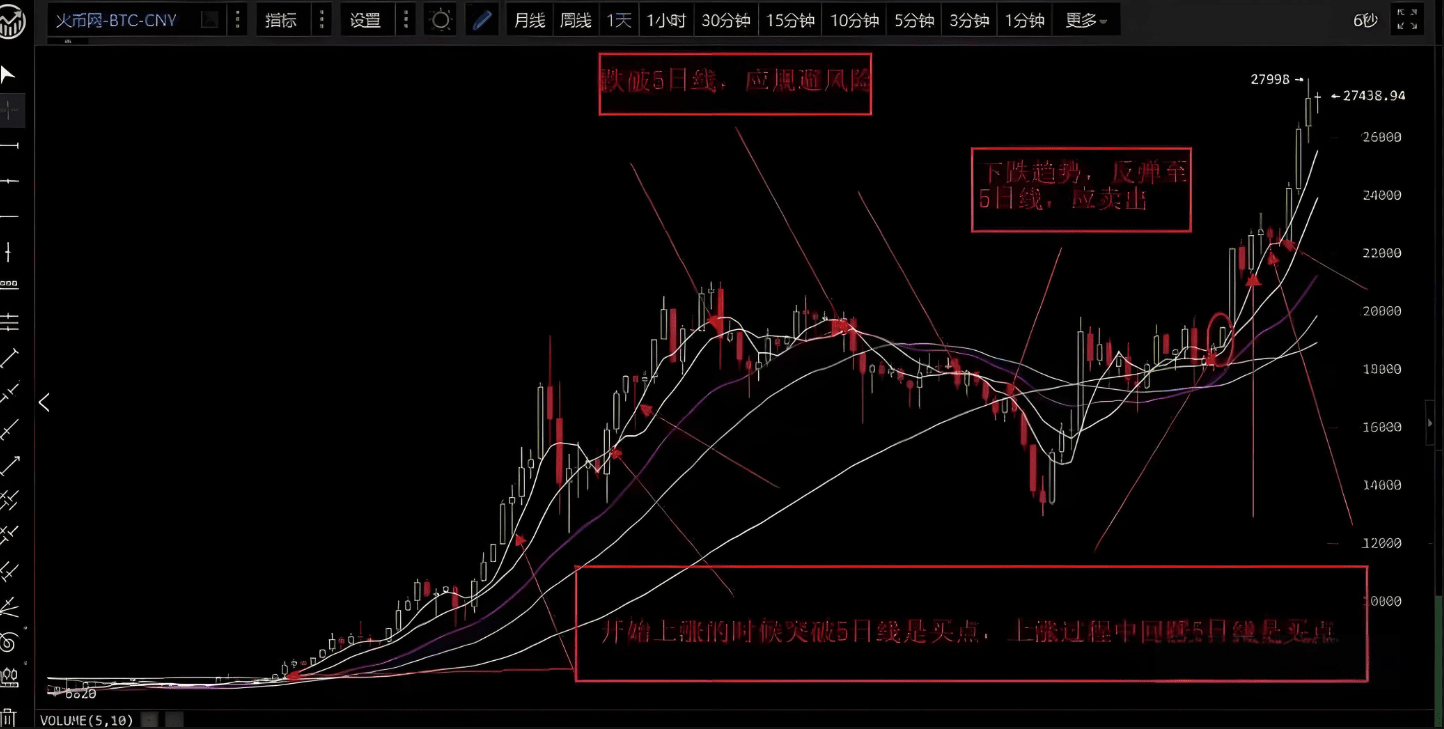
Usage: In a bull market, buying when the price retraces to the 5-day moving average is a good time to add to your position (if it breaks through quickly, you should wait and see); in a bear market...
In a downtrend, when the price breaks below the 5-day moving average, you must sell quickly. As long as it doesn't break through the 5-day moving average, there are basically no problems. In a consolidation period, you can look at the 1-hour chart...
and the 4-hour chart, which is the short-term usage.
This theory requires more exploration from everyone, because few people will tell you that you will encounter many problems in practice, which requires you to...
Verified, it is undeniable that the 5-day moving average trading strategy is very useful in actual combat and is one of the indicators that short-term experts must rely on.
Why use the 5-day line, because there is a saying that one day in the currency circle is one year in the world, and the market responds particularly quickly. If you use the conventional 7-day line, it will
More Slowly, Can't keep up with market changes, we all know that the crypto world's ups and downs are not limited, or even twenty-four hours
In the transaction.
If the 5-day moving average is used as the standard for judgment, then the price reaching the 5-day moving average will form a support level. If you sell, it will fall below the 5-day moving average, and once...
Once you have to wait until you return to the cost price, you can only wait, and this point also forms a support level.
It shows that the current price has not yet stood on the 5-day moving average, and there are still many uncertainties. At this time, it is time for us to use the hourly and four-hour charts.
Practical summary: This trading strategy mainly focuses on short-term indicators. When it approaches the moving average, which is everyone's cost price, the selling pressure will decrease, which is relatively...
The price will go up again. If it deviates too far from the moving average, the probability of adjustment will increase, mainly because investors will choose arbitrage.
Price drops.
3. Short-term trading strategy using the 30-day and 10-day moving averages:
The 30-day line is also a short-term and medium-term play. If you don't like trading so much, we recommend this set of tactics to you.
As usual, if you followed my previous settings: 5-day moving average, 30-day moving average, 60-day moving average, 120-day moving average, change the 60-day moving average to 10-day moving average.
line. Because this set of indicators only uses the 10-day and 30-day moving averages.
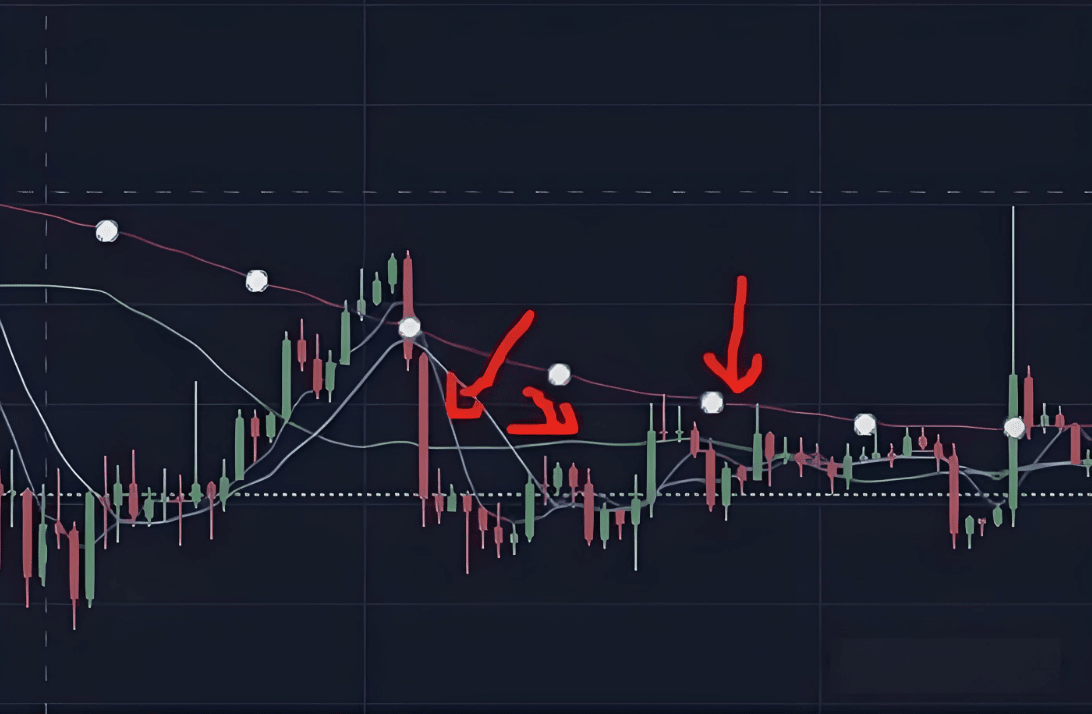
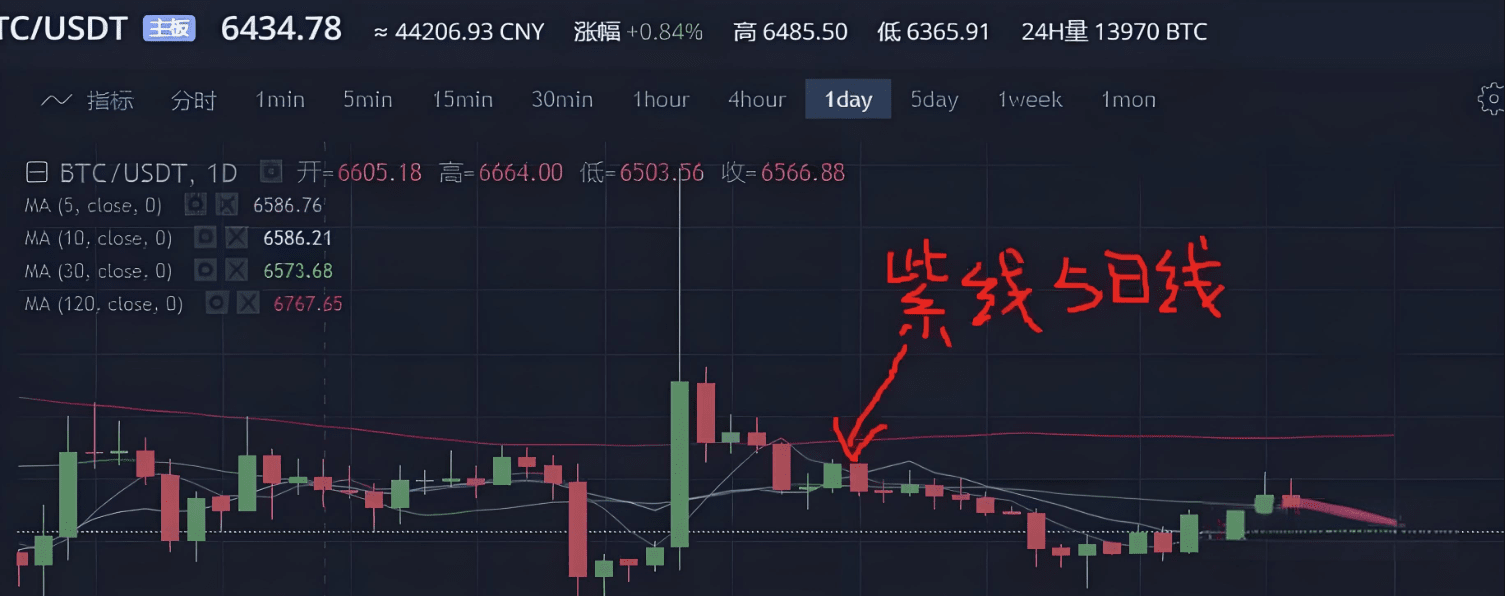
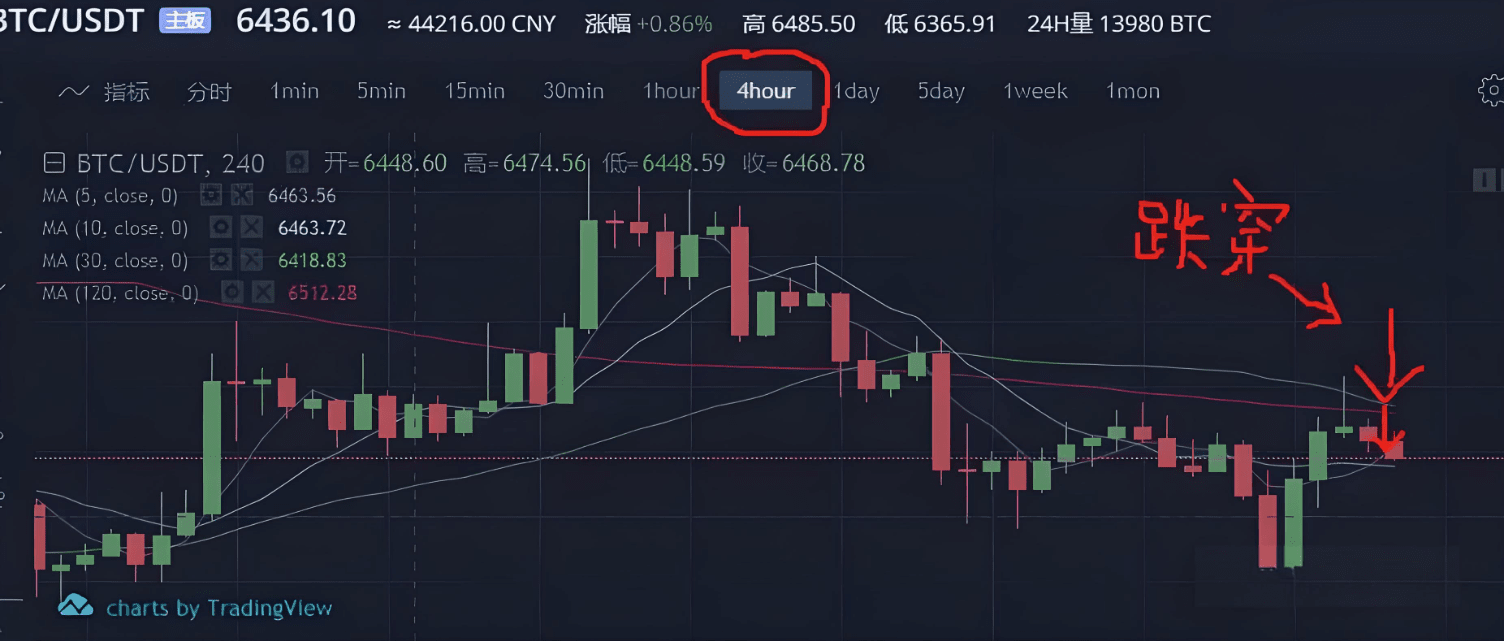
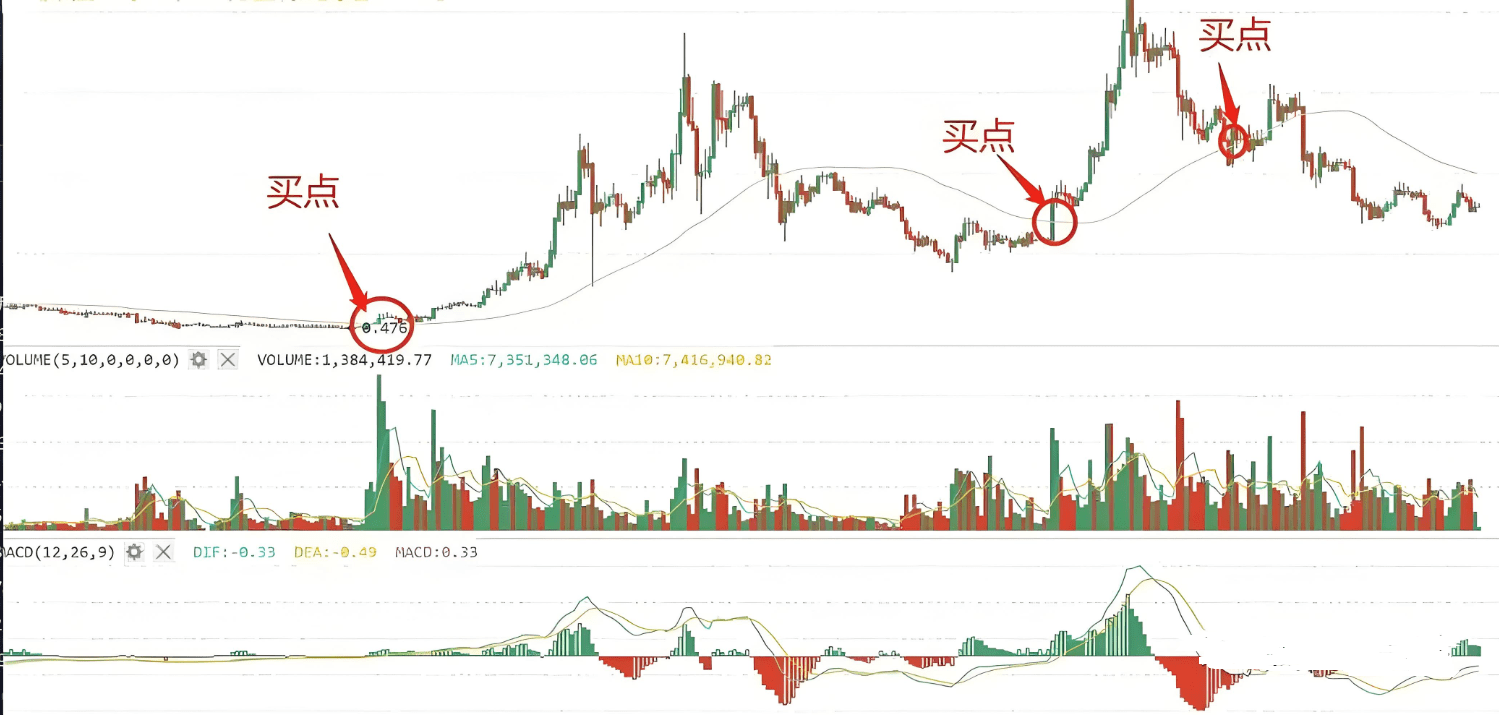
The usage of this set of indicators is relatively simple: sell when it falls below the 10-day moving average and buy when it breaks through the 30-day moving average. Change the time to one hour, as shown in detail in the figure:
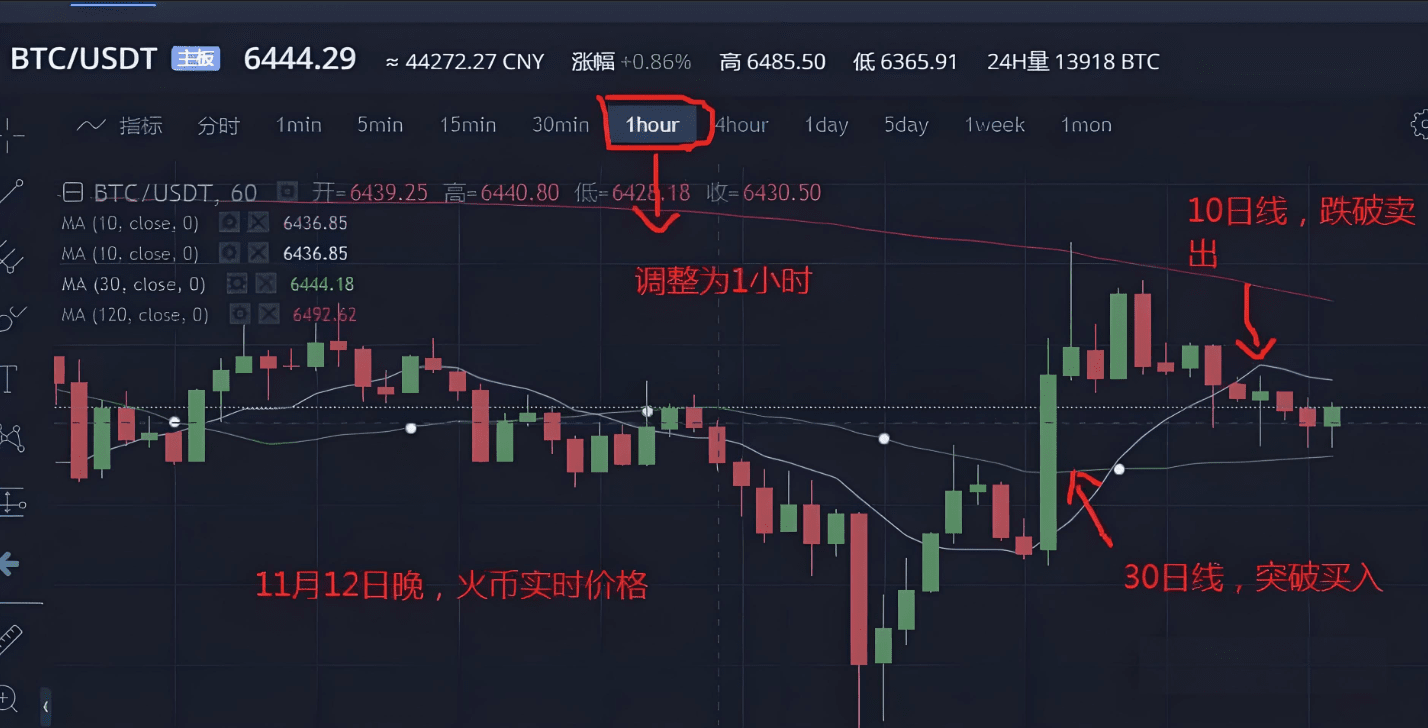
This theory is similar to the 5-day moving average. The 30-day moving average represents the short- to medium-term trend. Setting it to one hour turns it into a short-term buying point, while the drop...
Breaking through the 10-day moving average opens the short-term downtrend channel. The combination of these two things has a great effect in real-world combat.
4. Medium- and long-term trading strategy: 60-day and 120-day moving averages
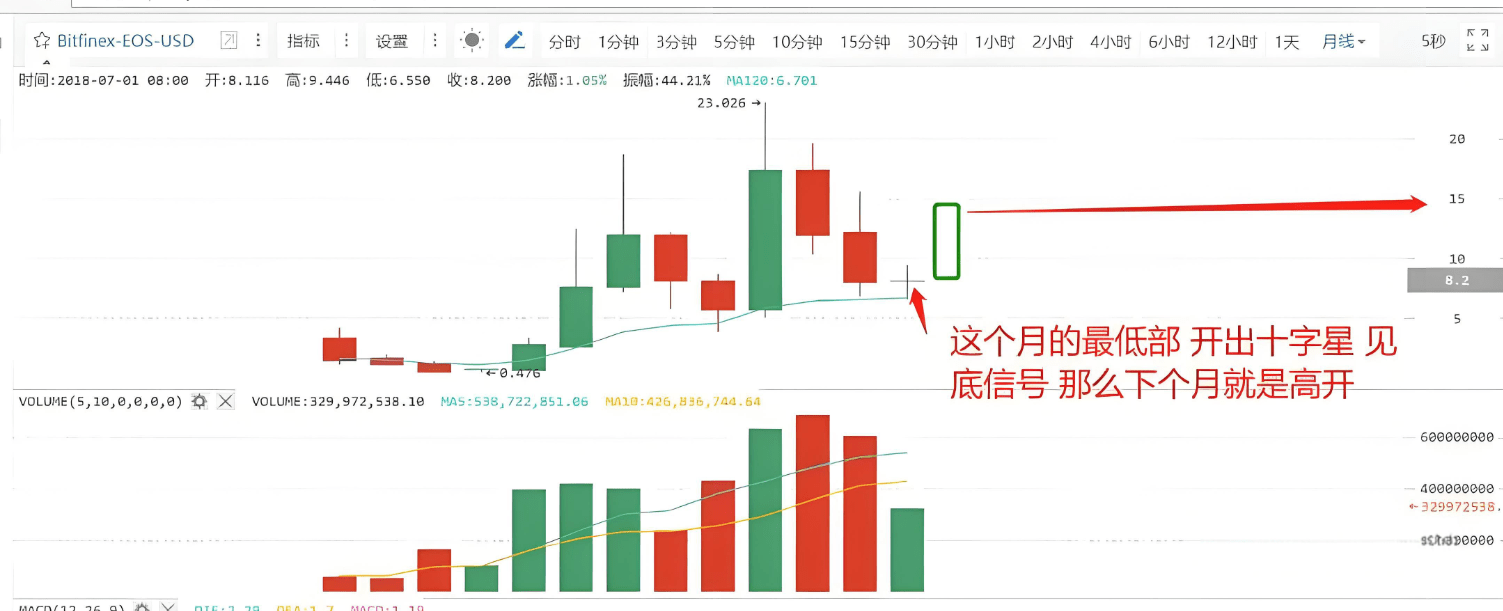
This chart is the trend chart of EOS. It is said that some investors make a few bottom-fishing trades every year through the 60-day moving average, which is a stable investment. This method is suitable for investors who do not have time to trade.
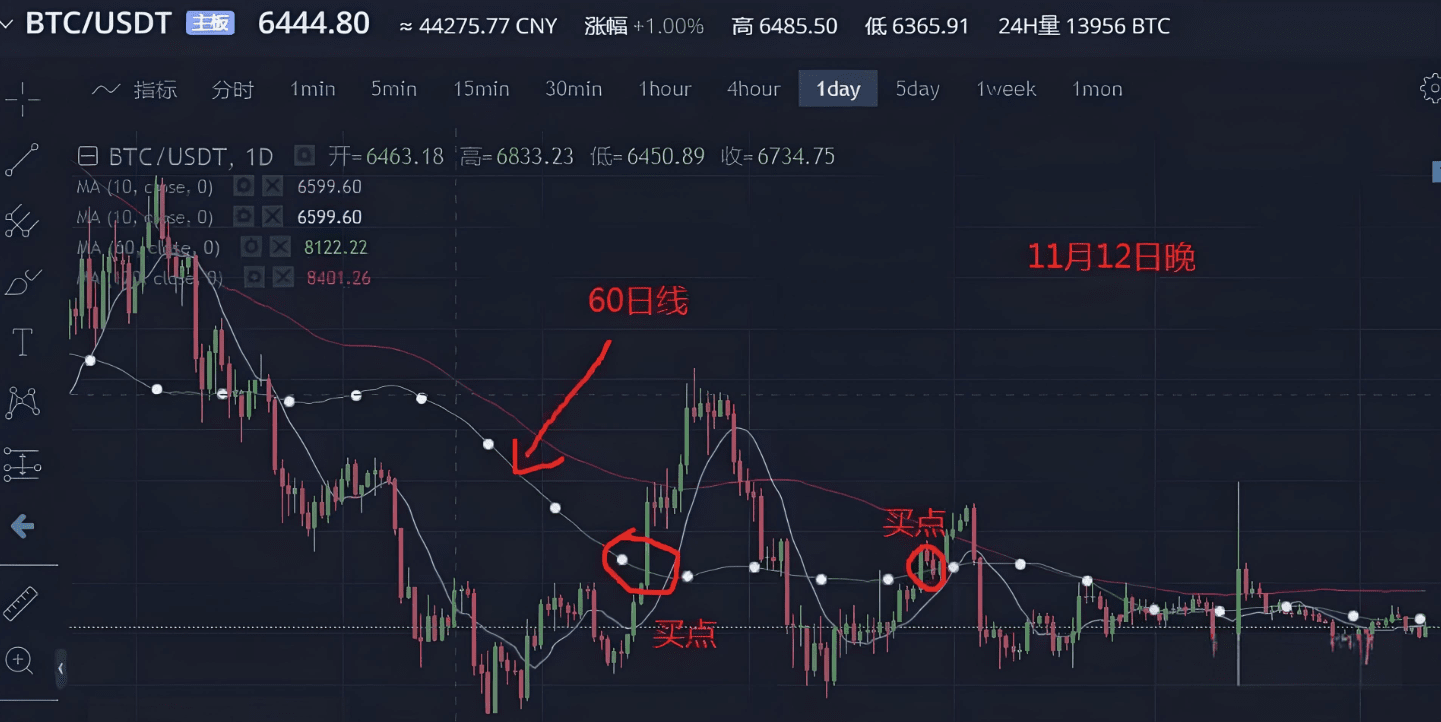
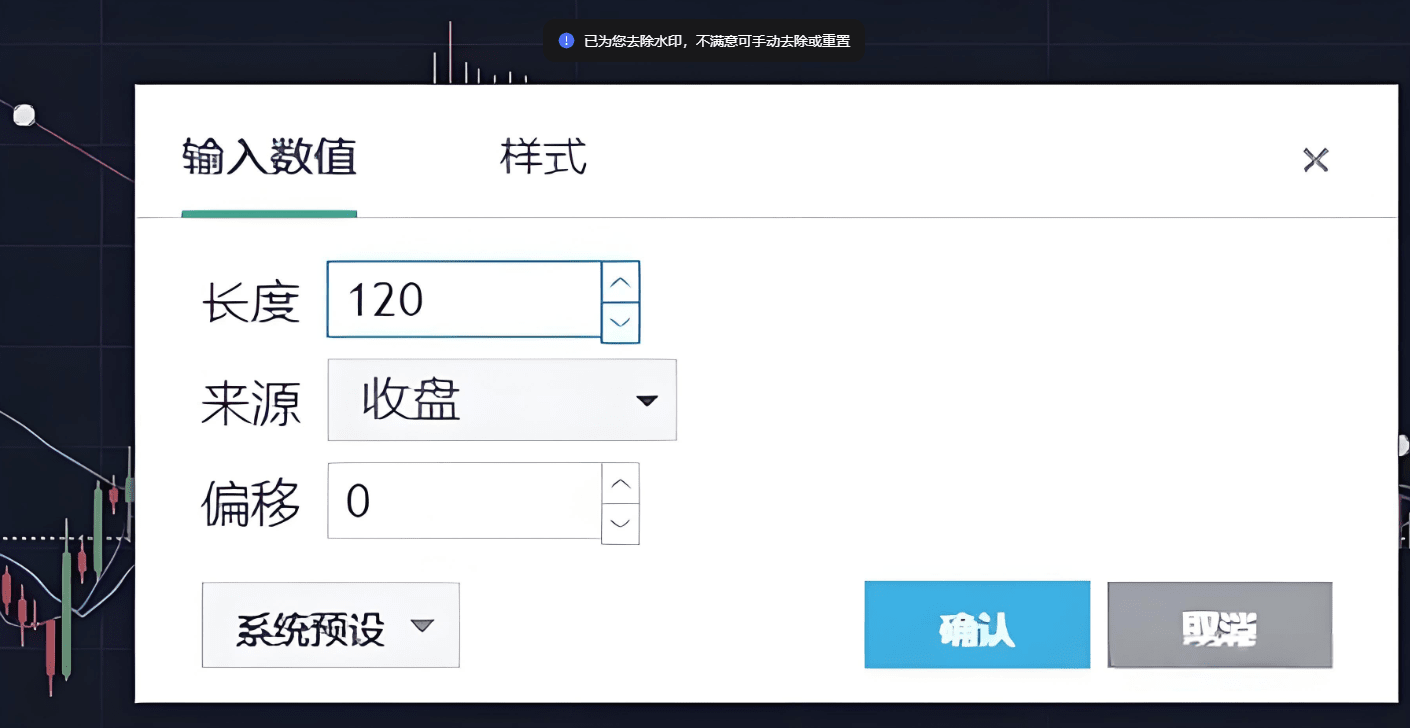
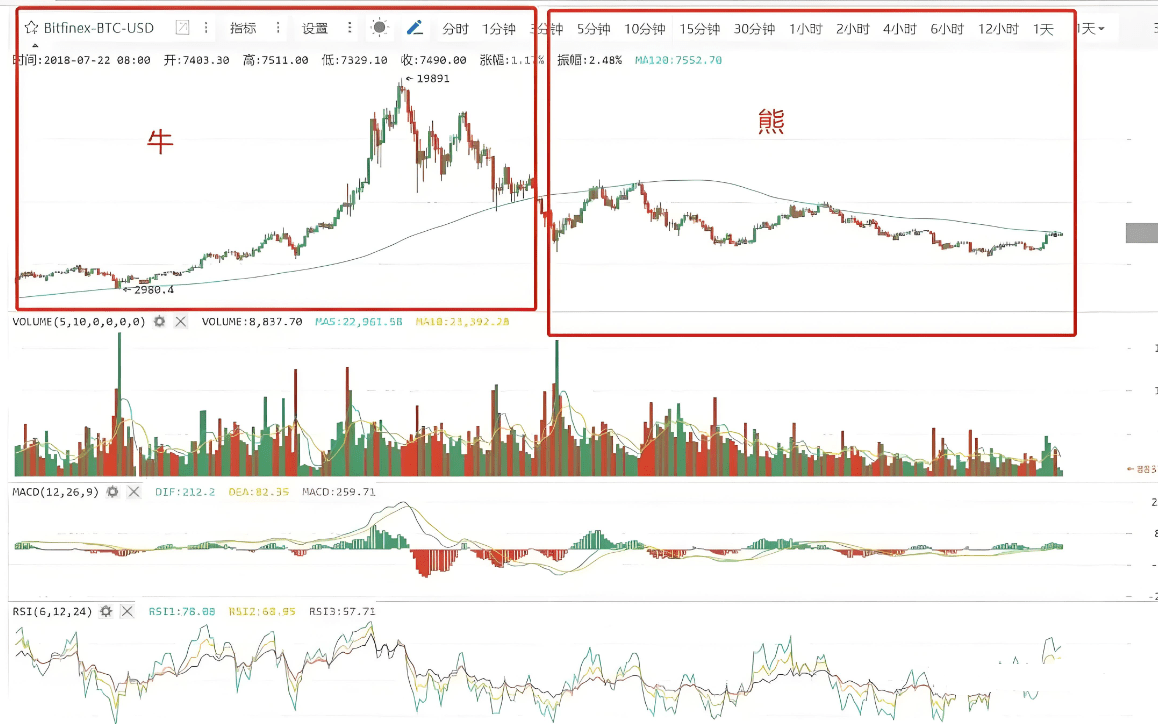
Speaking of the 120-day line, it is the dividing point between bull and bear.
So how to use the 120-day moving average for investment?
This is the previous technical chart, and according to the current market, it has never crossed the 120-day moving average. The usage of the 120-day moving average is actually to judge the long-term trend.
Trend technical indicator, which is also a reference basis in daily trading. This bear market has not yet ended, and once it crosses 120
Daily line is the indicator to determine the arrival of a bull market.
We often see the pressure and support levels mentioned by various experts are actually averages. If you want to analyze the big trend, do long-term investment...
you can't look at the 5-day moving average trading strategy. The main reference moving average for bull-bear conversion is the 120-day moving average.
5. Look at pressure and support with box waves.
This is from Elliott Wave Theory*, which has a good explanation of the wave trading strategy. Many novices in the stock market once relied on this theory...
Sweeping the stock market for many years, of course, it is not known whether it is practical or not, after all, seeing is believing. Here we briefly introduce the box wave support and...
Pressure level.
When the coin price is running in a certain box, the formed wave, the highest point of each wave is on a line, which is the pressure level, then the bottom of the wave...
All connected into a line is the support level. The general judgment is that a breakthrough may usher in a higher charge. In this case, how to choose?
What to choose? The main point comes from the fundamentals, that is, following the trend of a wave when good news is released or large funds enter the market.
Condition, another situation is that after the breakthrough, there is a shock, this is also more common, indicating that the funds are unable to attack or the selling pressure is too high, at this time...
You have to be cautious, of course, such a span will be relatively large, and can only be used as a reference.
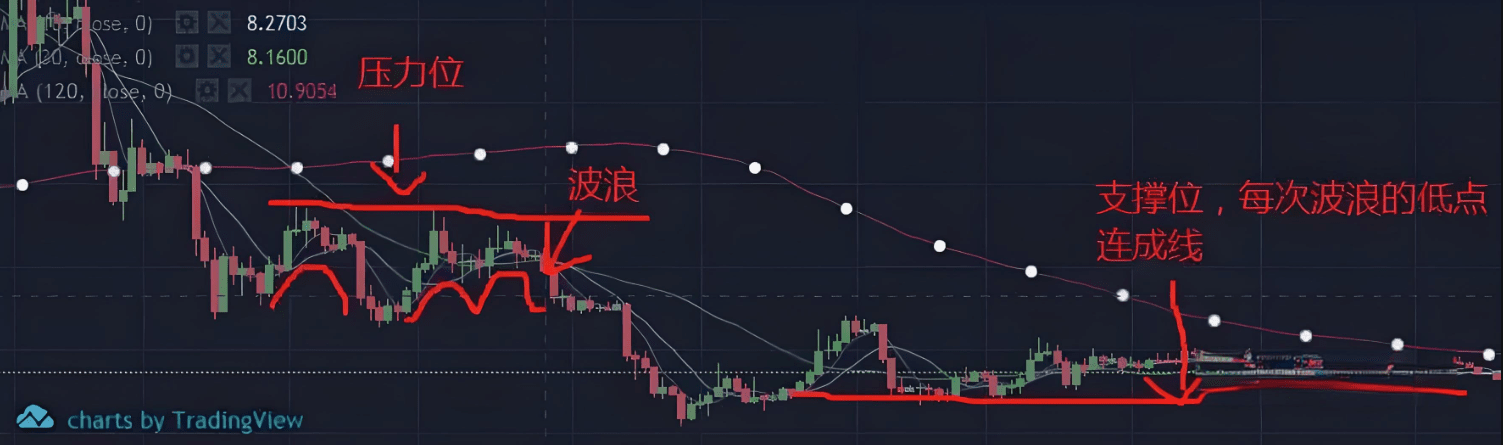
Looking at the low and high points of each time through the box wave to judge the support and pressure is also a more common analysis method, brainless and simple.
But it is not so accurate. You can explore it in daily practice, or read technical books on wave theory. Of course, to be honest...
Speaking of which, I have read a few good wave books, but in real-world combat, the effect is not very good, but it does not mean that everyone's effect after reading is...
Everything still depends on practical exploration. I prefer practical techniques rather than conceptual things, what do you think!
6. RSI Bottom-Fishing Escape Rule
RSI is also an old technical indicator in the stock market, and it has a particularly good reference effect in the crypto world.
The RSI indicator represents a degree of strength and weakness, and it is a value obtained by calculating the statistics of the rise and fall of the coin price.
The principle of the RSI indicator is, simply put, to calculate the strength comparison between buyers and sellers by using a numerical calculation method. For example, if one hundred people buy...
If sixty people buy a coin and forty people sell it, the coin price will rise.
So how to use it? 80-100 is extremely strong to sell; 20-50 is extremely strong to buy; weak to wait and see 0-20 is extremely weak to buy. One...
Once it reaches the golden cross, it becomes a buying and selling point.
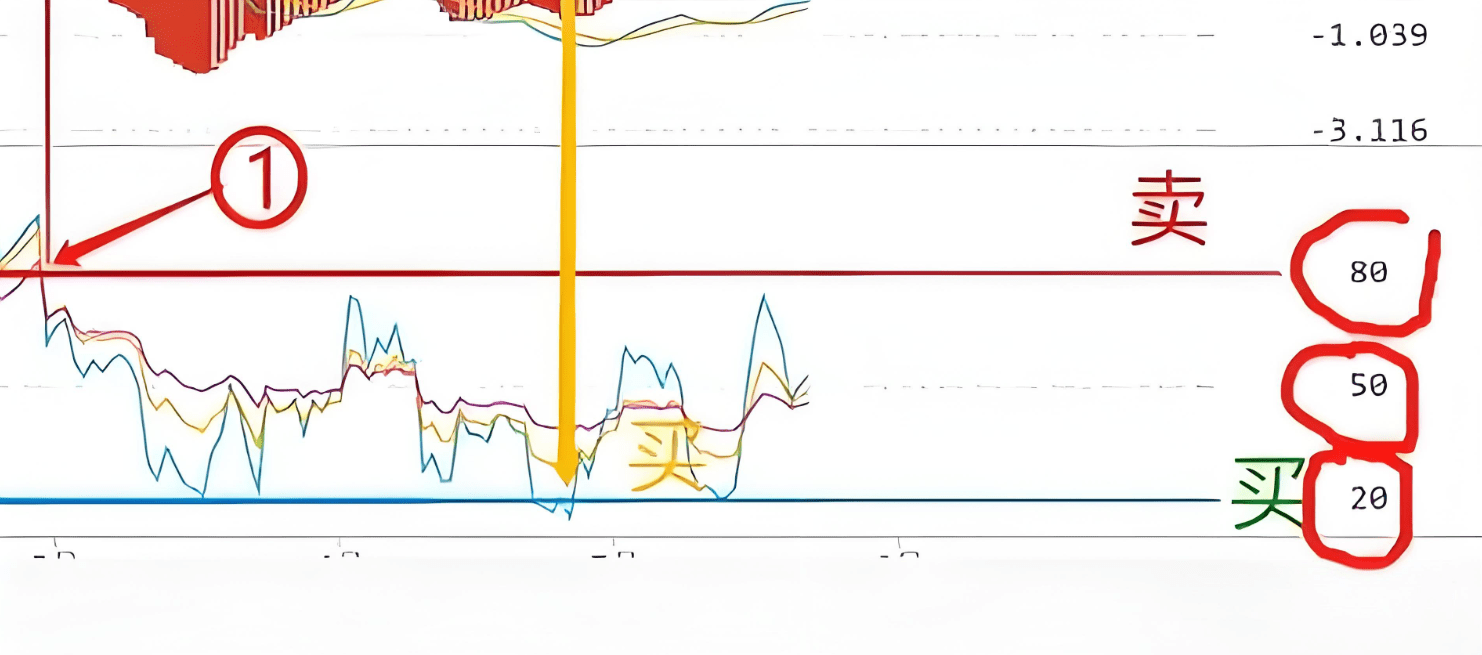
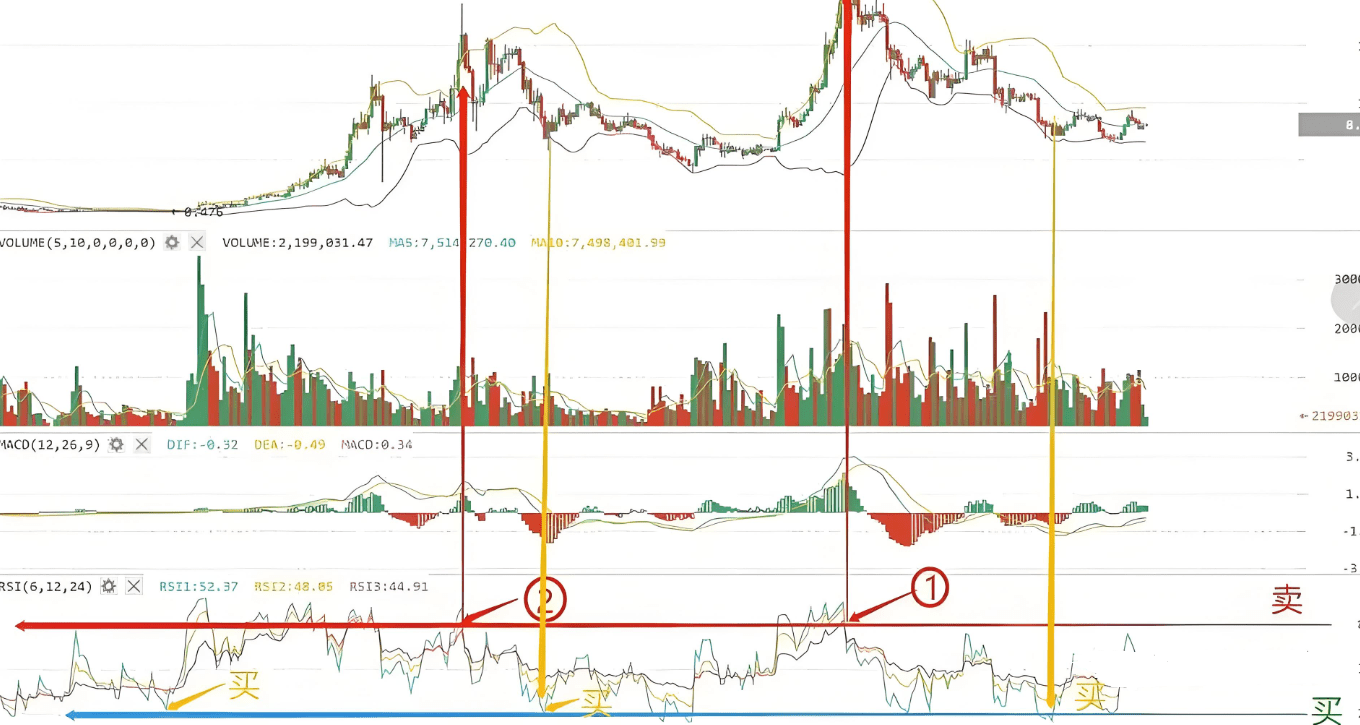
Note that if it reaches 80, there is a great risk of callback, so when should you sell? Sell at the moment when it falls below 80. RSI technology is...
After market verification, it has been used by people since 1978, which shows how valuable its reference is. In the emerging currency...
circle, this set of indicators can also effectively lead you to victory.
You can choose to operate on the one-hour line for short-term wave bands to achieve wave band escape.
Summary: Let's review the five technical indicators we talked about today: the 5-day moving average trading strategy, the combination of 10-day and 30-day moving averages with indicators, and the...
The role of the 60-day and 120-day moving averages in long-term trading strategies, support and resistance levels in box fluctuations, and the RSI overbought and oversold rules. Although the above reference indicators...
Many are very simple, but in fact, the simpler the reference indicators, the better they are to use. In actual combat, we have introduced five techniques to you above.
Crypto trading methods. Through practical investment, I believe there is always one that can bring you a different investment experience, and there is always one that can become your...
A weapon on the road to investment.
You don't need to stay up late to stare at the market and guess the trend, and you don't need to worry about whether the buying and selling points are accurate. Only do opportunities with clear trends, control your hands in bear markets, and hold your positions in bull markets. @加密大师兄888 , in the next wave of market, I will say, let's eat meat together by stepping on the rhythm, and let the profits run ahead of 90% of retail investors! Remember, the crypto world does not lack opportunities, but the execution to keep up.
