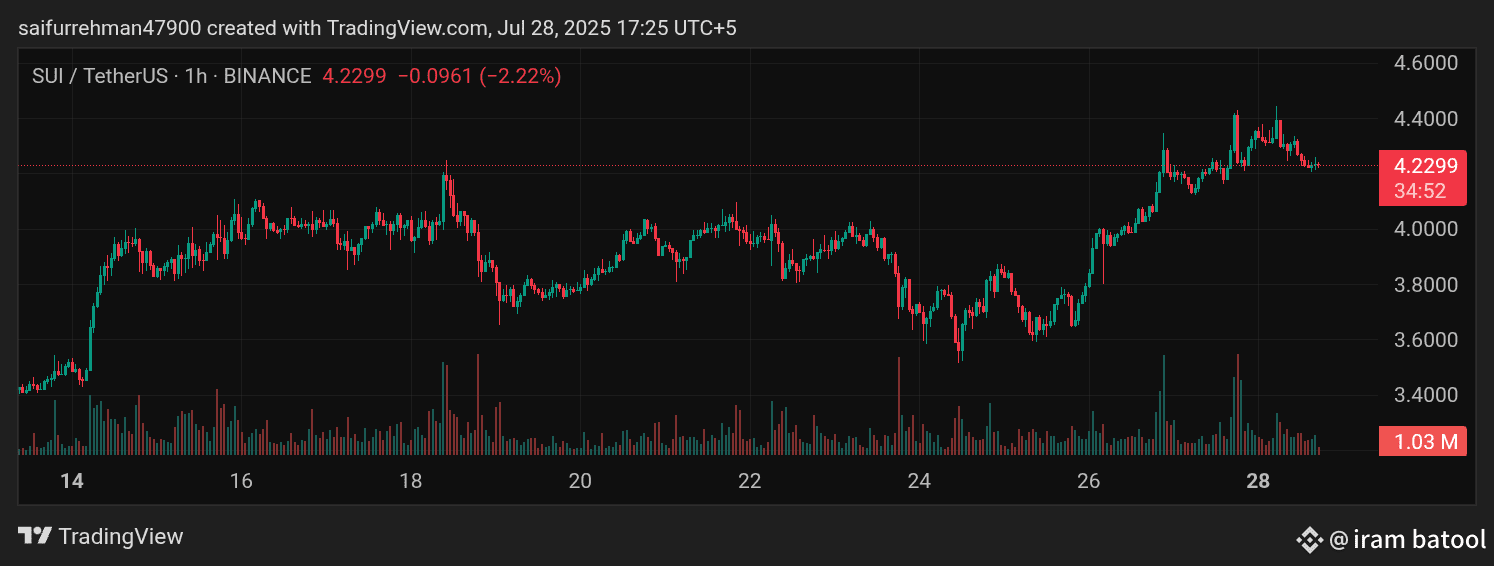
🕐 1-Hour Chart Overview:
Current Price: $4.2257
Recent High: ~$4.44
Trend: Still in a short-term uptrend, but now pulling back
Volume: Spiking on up moves, fading on pullbacks — bullish behavior
🔍 Key Technical Observations:
✅ Bullish Signs:
Strong breakout from $3.60–$3.80 base
Higher highs and higher lows since July 25
Pullback is controlled, not a crash (healthy correction)
⚠️ Bearish Signs:
Price got rejected near $4.44 twice (forming potential double top)
Currently testing a minor support area ($4.20–$4.22)
If it breaks below $4.20, it could drop toward $4.00
📌 Strategy Based on Current Setup:
🔽 If you are in a long trade:
Hold only if $4.20 support holds and price bounces
Stop-loss: below $4.17
Take-profit: re-test of $4.40+
📉 Looking to short:
Wait for breakdown below $4.20 with volume
Target: $4.00 and possibly $3.90
Stop-loss: above $4.26
🔼 Looking to buy/dip long:
Best entry = $4.00 or $3.90 support zone
Wait for confirmation candle or reversal pattern there
🔁 Summary:
Timeframe Signal Action
5-min Bearish Sell/Short
1-hour Pullback Wait/Watch
Best Play Support Re-test Buy near $4.00 if confirmed