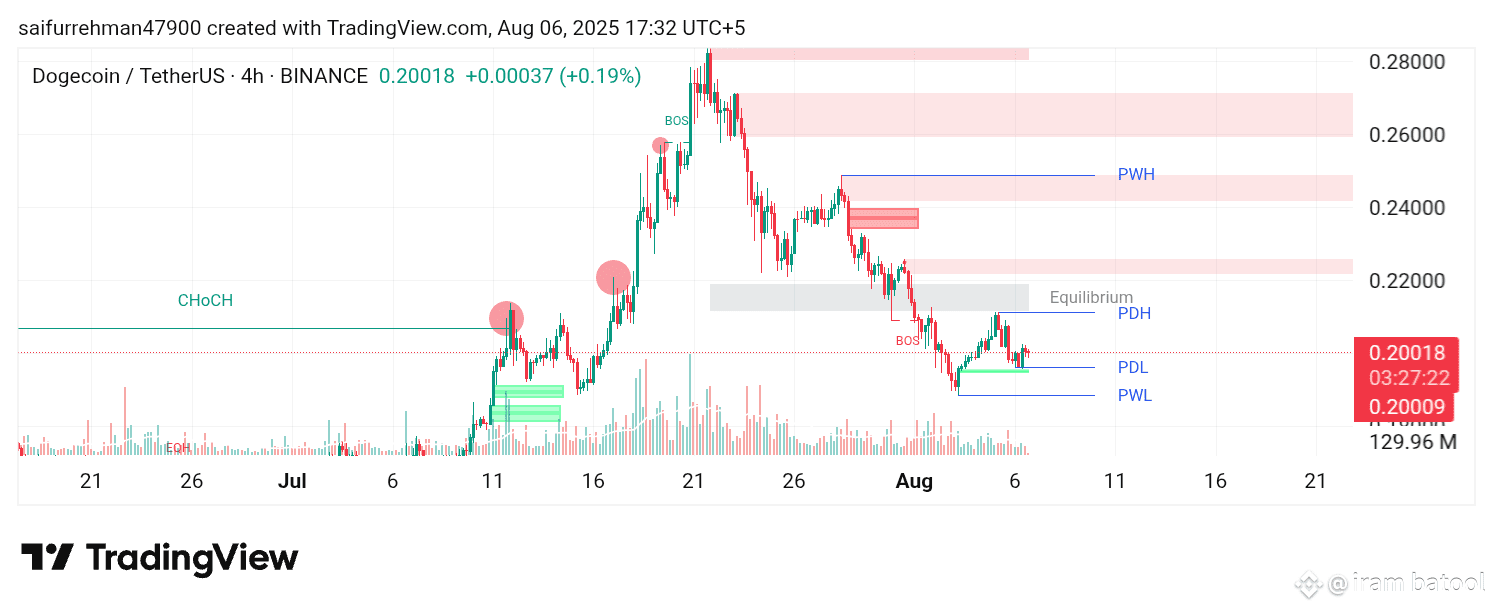
Based on the chart you shared for DOGE/USDT (4h timeframe), let’s analyze it and provide a trade idea with:
Clear Buy/Sell direction
Entry
Take Profit (TP) and Stop Loss (SL)
Risk to Reward Ratio (RRR): 1:2 or 1:3
Win rate context
---
🔍 Chart Breakdown
Current Price: $0.20018
Recent Market Structure:
CHOCH (Change of Character) marked earlier → bullish shift
BOS (Break of Structure) to the downside → bearish control recently
Price Zones:
PDH (Previous Day High): $0.213
PDL (Previous Day Low): $0.193
PWL (Previous Week Low): ~$0.190
PWH (Previous Week High): ~$0.246
Current Price Location: Between Equilibrium & PDL, indicating potential liquidity below
---
✅ Trade Setup (Sell – Short Bias)
Because the market recently broke structure to the downside, and price is now below equilibrium and unable to break above PDH, a sell setup is higher probability.
---
📉 Sell Entry Setup
Sell Entry: $0.203 – $0.205 (near imbalance zone / small supply zone above)
Stop Loss (SL): $0.210 (above PDH / invalidation of lower high)
Take Profit (TP):
1:2 TP: $0.189
1:3 TP: $0.183
---
📊 Risk to Reward
Risk Reward TP RRR
0.007 (205 – 198) 0.014 0.189 1:2
0.007 0.021 0.183 1:3
---
🧠 Win Rate Consideration
For setups like this with supply zone rejections and structure-based BOS:
Expected win rate: 50%–65%
With RRR of 1:2+, even 40% win rate = profitable strategy
---
⚠️ Invalidations
If price closes strongly above $0.210, this trade becomes invalid (change to bullish bias).
If price breaks below $0.190 and finds support with high volume, it may reverse — consider trailing stop.
---
📌 Summary
Direction: SELL
Entry Zone: $0.203 – $0.205
Stop Loss: $0.210
Take Profit:
TP1: $0.189 (1:2)
TP2: $0.183 (1:3)
Bias: Bearish, based on BOS and equilibrium rejection
Would you like a Buy setup instead or want this turned into a visual chart?