COIN NAME : $XMR
SIGNAL TYPE : LONG
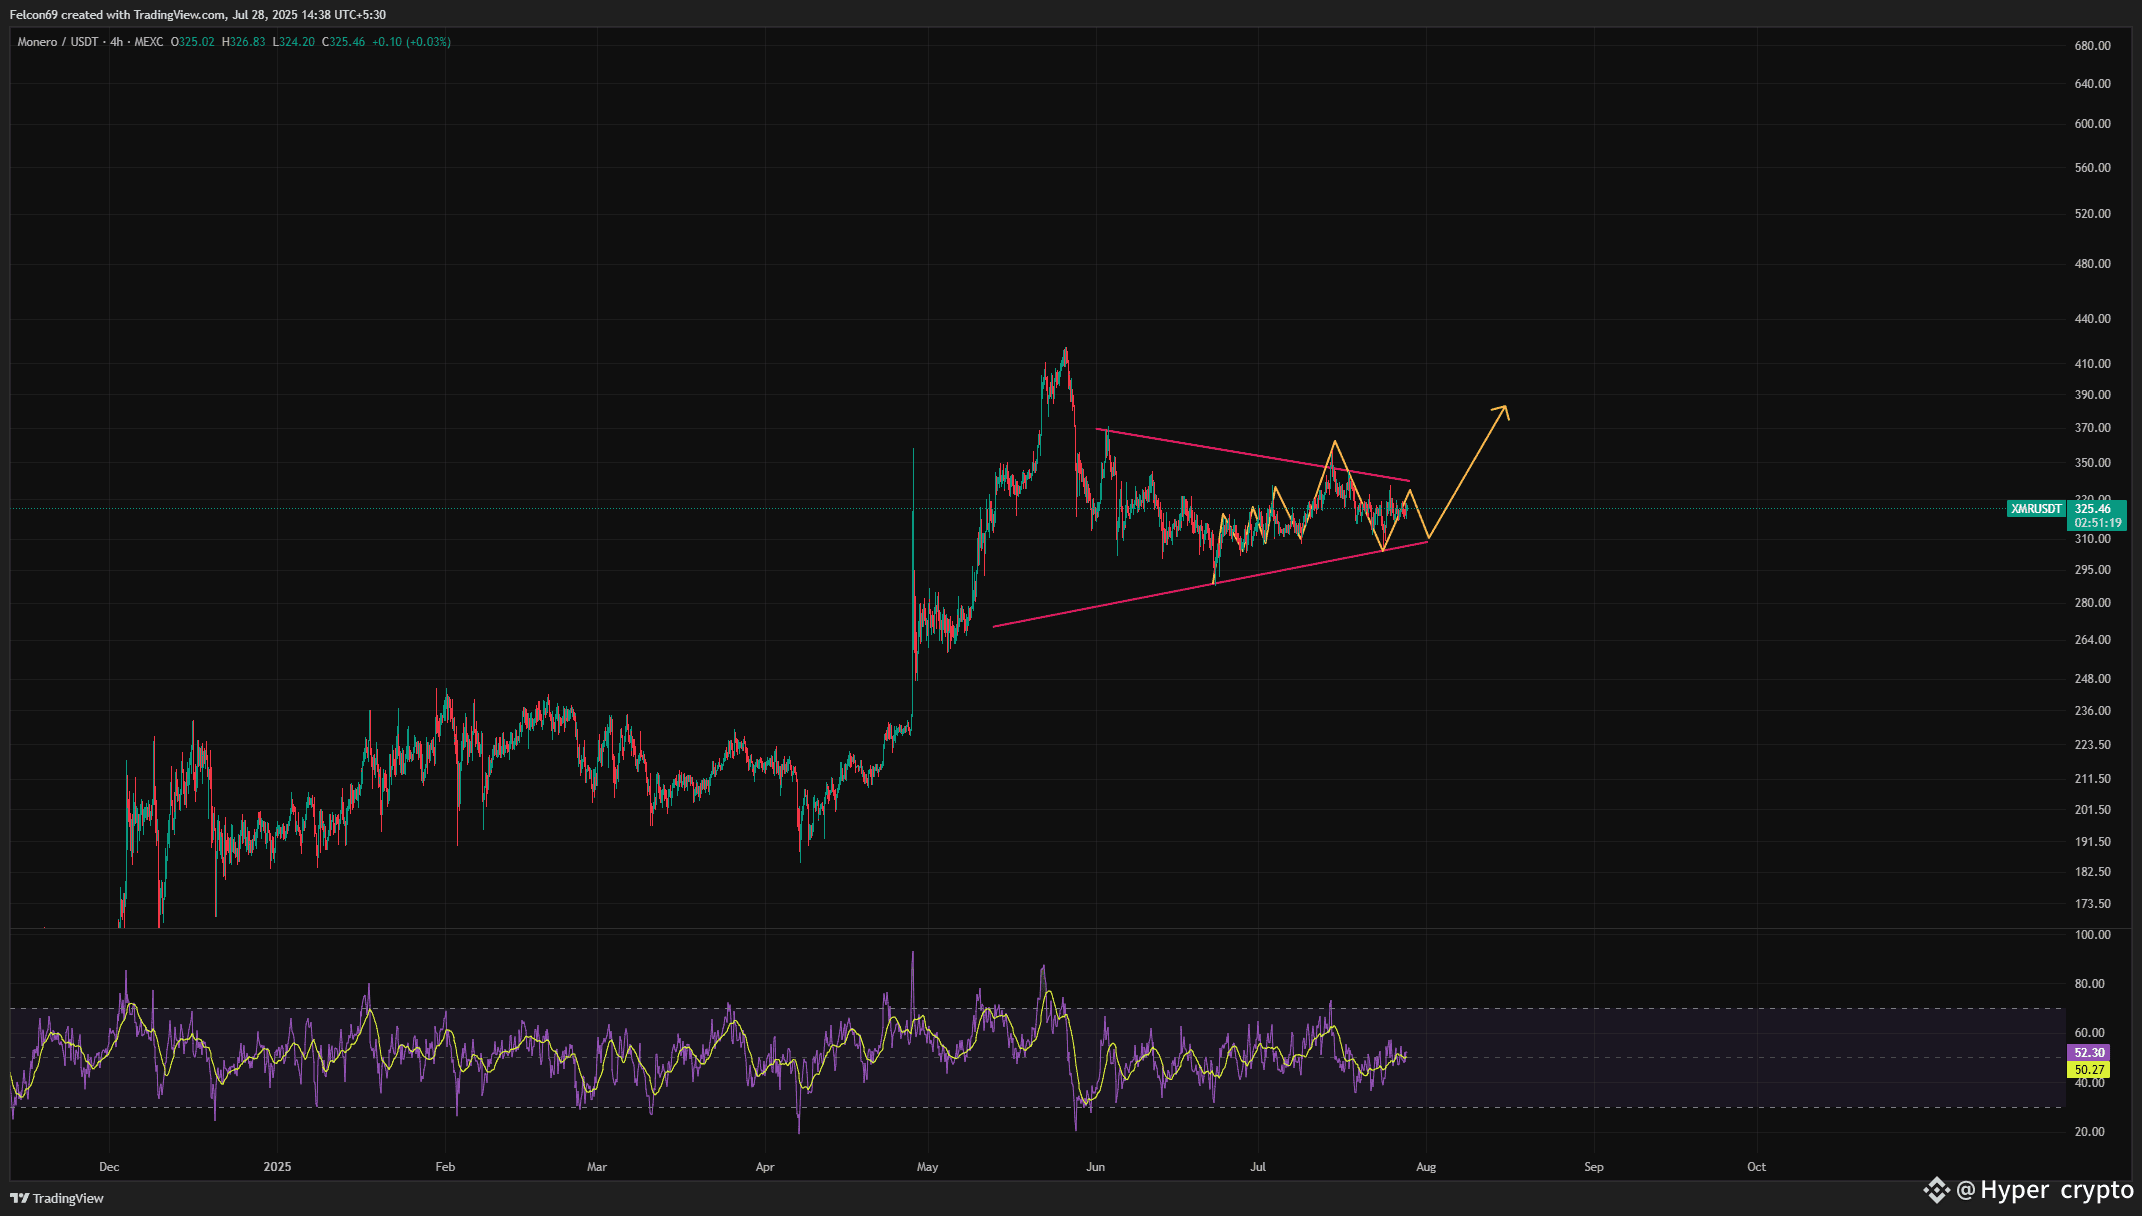
1) I can see XMR on a 4-hour timeframe, forming a symmetrical triangle pattern. The price is consolidating within the narrowing triangle, indicating indecision in the market. The RSI is currently at 50.31, suggesting a neutral market, but with potential for either upward or downward movement. The price is bouncing between the upper and lower trendlines of the triangle, showing possible accumulation before the next significant move.
2) This chart OTHERS on a daily timeframe. The price is trading within a downward-sloping channel, with the market recently testing the lower trendline. The RSI is at 63.95, indicating a healthy market with bullish potential, as it is not yet overbought.
(JOIN OUR BINANCE LIVE SECTION FOR MORE DEATAILS AND UPDATE INFORMATION)
ENTRY PRICE: 310.83 (or market price)
1st tp: 324.48
2nd tp: 339.27
3rd tp: 355.86
Leverage: 5x
(JOIN OUR BINANCE LIVE SECTION FOR MORE DEATAILS AND UPDATE INFORMATION)
