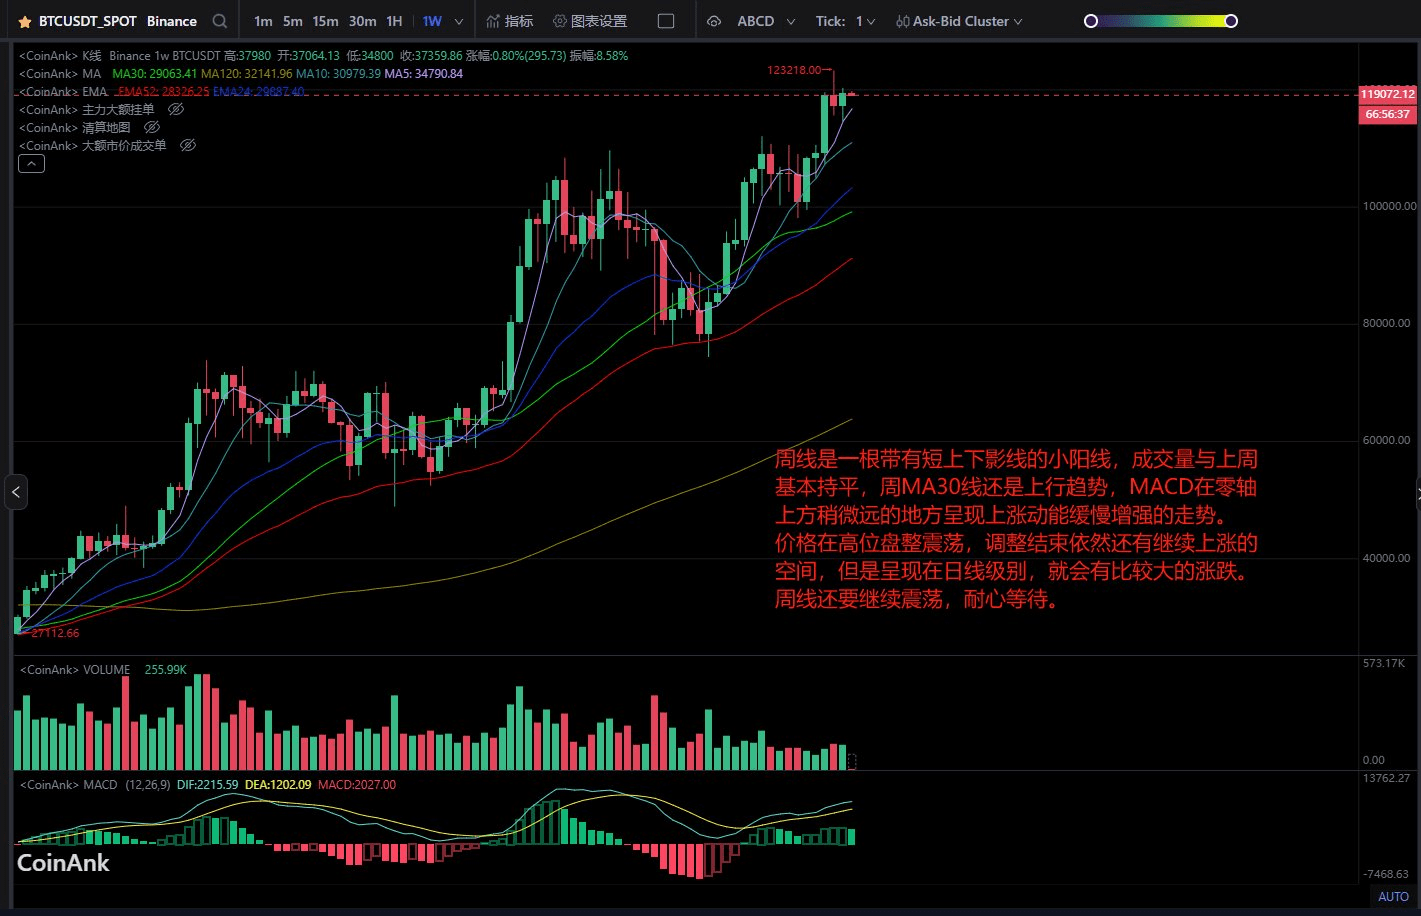
The weekly chart shows a small bullish candle with short upper and lower shadows, and trading volume is roughly the same as last week. The weekly MA30 line is still on an upward trend, and the MACD is showing a slowly increasing upward momentum, slightly above the zero axis.
The price is consolidating at a high level, and although the adjustment is ending, there is still room for further increases. However, on the daily chart, there will be significant fluctuations. The weekly chart will continue to oscillate; patience is needed.
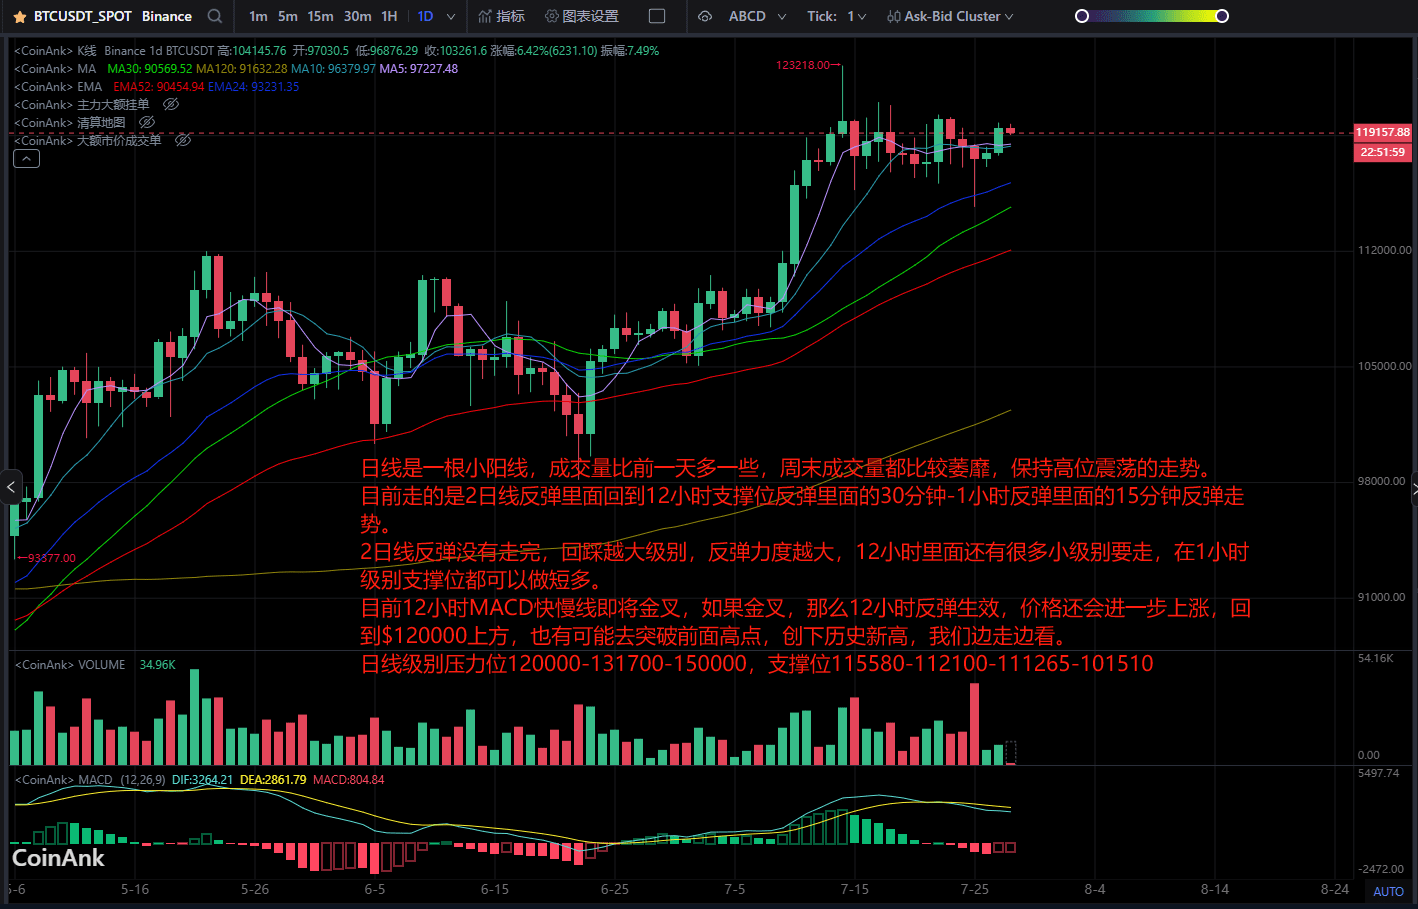
The daily chart shows a small bullish candle with slightly increased trading volume compared to the previous day. Trading volume remains sluggish over the weekend, maintaining a high-level oscillating trend.
Currently, it is a 2-day line rebound returning to the 12-hour support rebound, within the 30-minute to 1-hour rebound, and the 15-minute rebound trend.
The 2-day line rebound is not complete, and the larger the pullback, the stronger the rebound. There are still many smaller levels to navigate within the 12-hour timeframe, and short-term longs can be taken at the support levels on the 1-hour chart.
Currently, the 12-hour MACD fast and slow lines are about to golden cross. If the golden cross occurs, the 12-hour rebound will take effect, and the price will further rise, returning above $120,000. It is also possible to break through the previous high and set a new historical high; we will observe as we go.
Daily level resistance at 120000-131700-150000, support at 115580-112100-111265-101510.