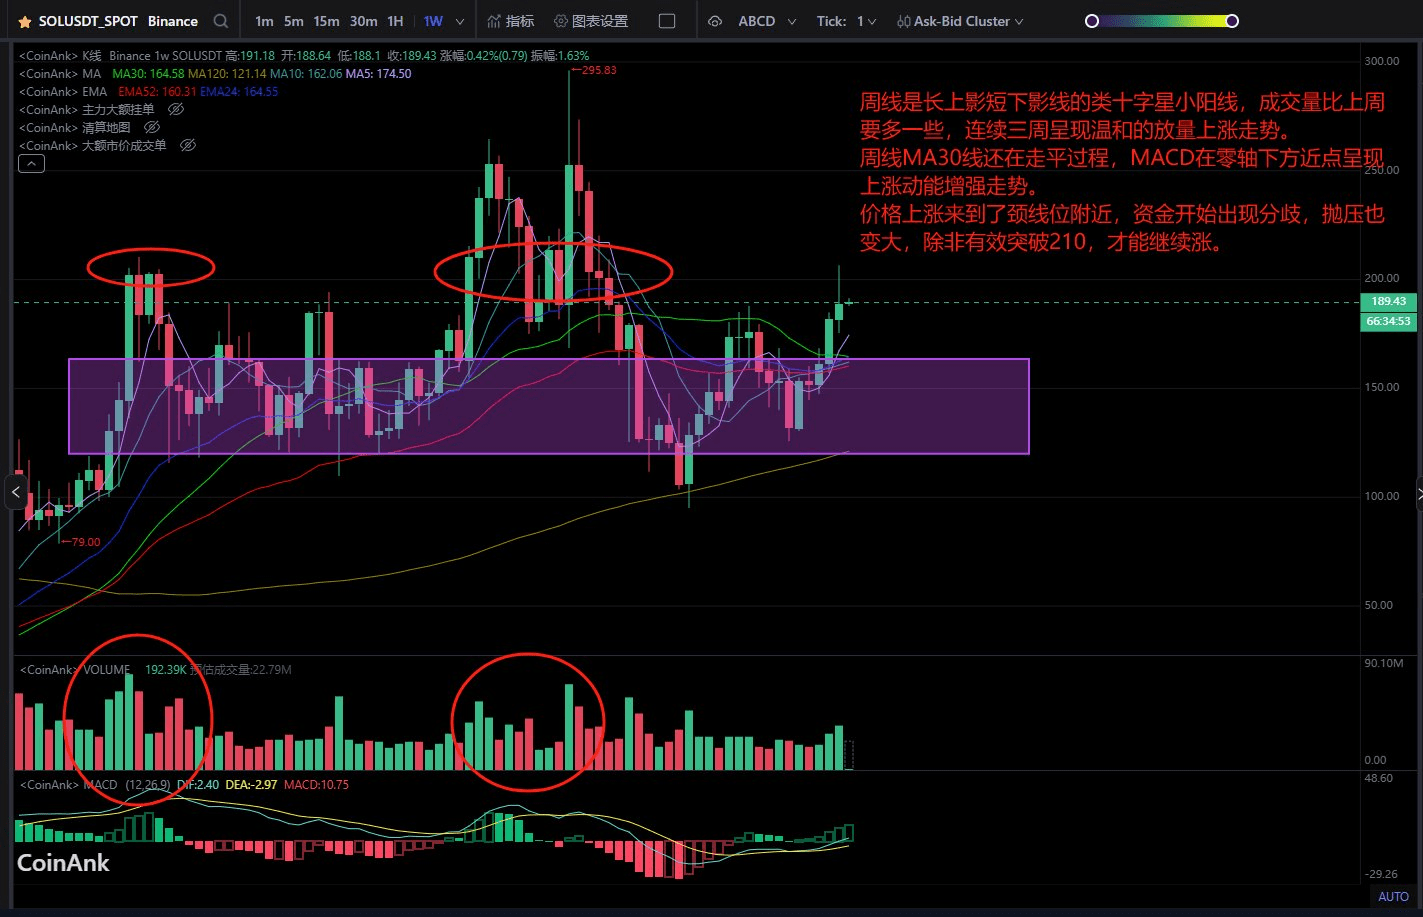
The weekly line is a small bullish line resembling a cross with a long upper shadow and a short lower shadow, and the trading volume is slightly higher than last week, showing a gentle increasing trend for three consecutive weeks.
The weekly MA30 line is still in the process of flattening, and the MACD is showing an increasing momentum near the zero axis.
The price has risen to near the neckline, and funds are starting to show divergence with increased selling pressure. Unless there is an effective breakout above 210, the price can continue to rise.
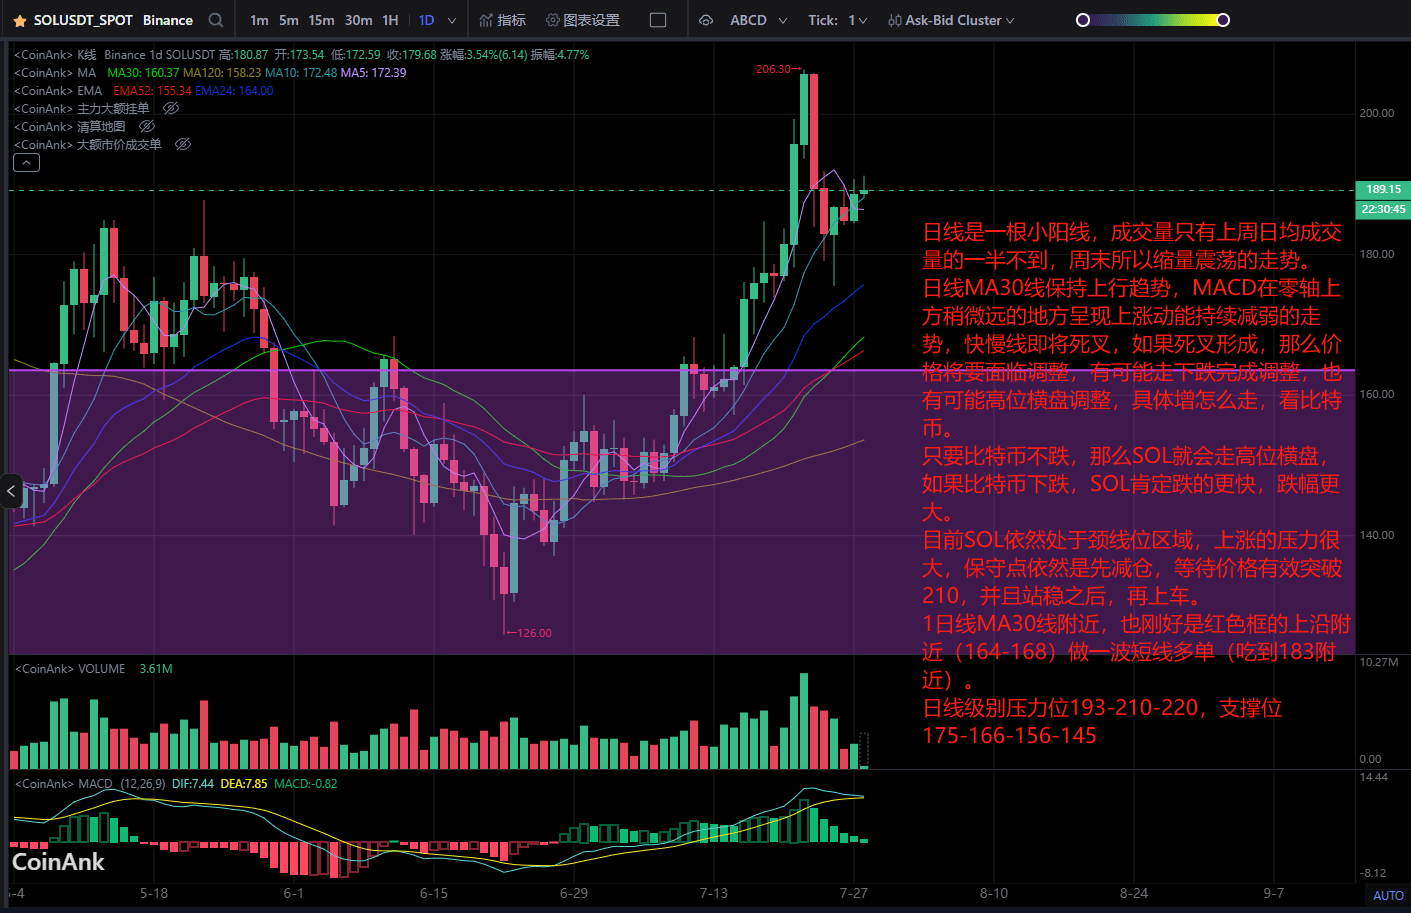
The daily line is a small bullish line, with the trading volume being less than half of last week's daily average volume, showing a shrinking volatility trend over the weekend.
The daily MA30 line maintains an upward trend, and the MACD shows a continued weakening of upward momentum at a slight distance above the zero axis. The fast and slow lines are about to cross; if the crossover occurs, the price will face an adjustment. It may either decline to complete the adjustment or consolidate at a high level. The specific path depends on Bitcoin.
As long as Bitcoin does not fall, SOL will remain in a high-level consolidation. If Bitcoin drops, SOL will definitely fall faster and by a larger margin.
Currently, SOL is still in the neckline area, facing significant upward pressure. It is prudent to reduce positions first and wait for the price to effectively break above 210 and stabilize before entering again.
Near the daily MA30 line, which happens to be near the upper edge of the red box (164-168), a short-term long position can be made (to take profit around 183).
Daily level resistance at 193-210-220, support at 175-166-156-145