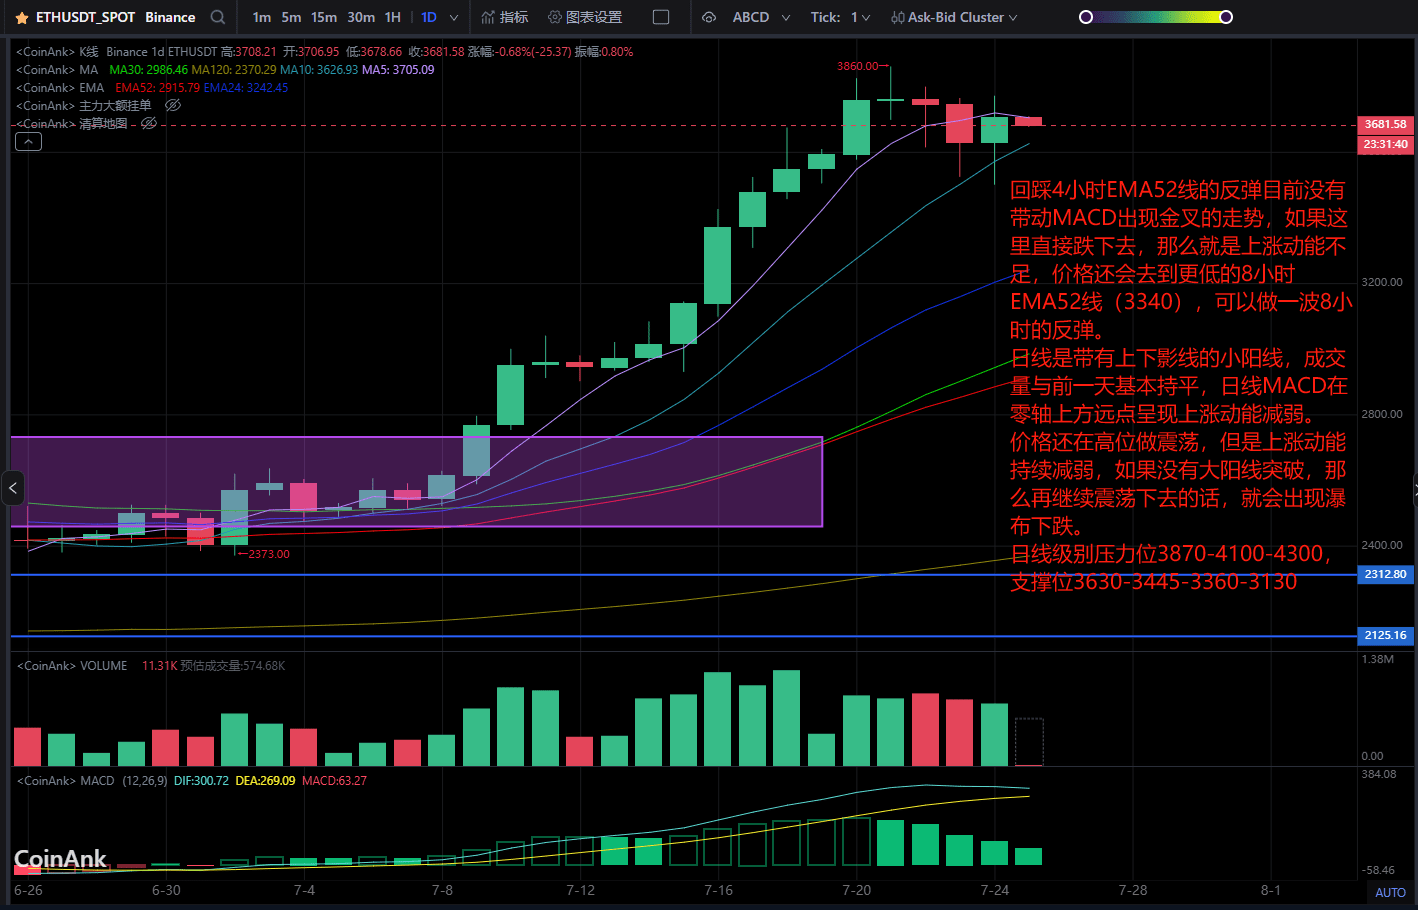
The rebound after testing the 4-hour EMA52 line has not triggered a bullish crossover in the MACD. If it drops directly from here, it indicates insufficient upward momentum, and the price will go lower to the 8-hour EMA52 line (3340), where a rebound on the 8-hour chart can occur.
The daily chart shows a small bullish candle with both upper and lower shadows, and the trading volume is basically the same as the previous day. The daily MACD is showing a weakening upward momentum above the zero line.
The price is still oscillating at a high level, but the upward momentum continues to weaken. If there is no large bullish candle to break through, continued oscillation may lead to a waterfall decline.
Daily resistance levels 3870-4100-4300, support levels 3630-3445-3360-3130