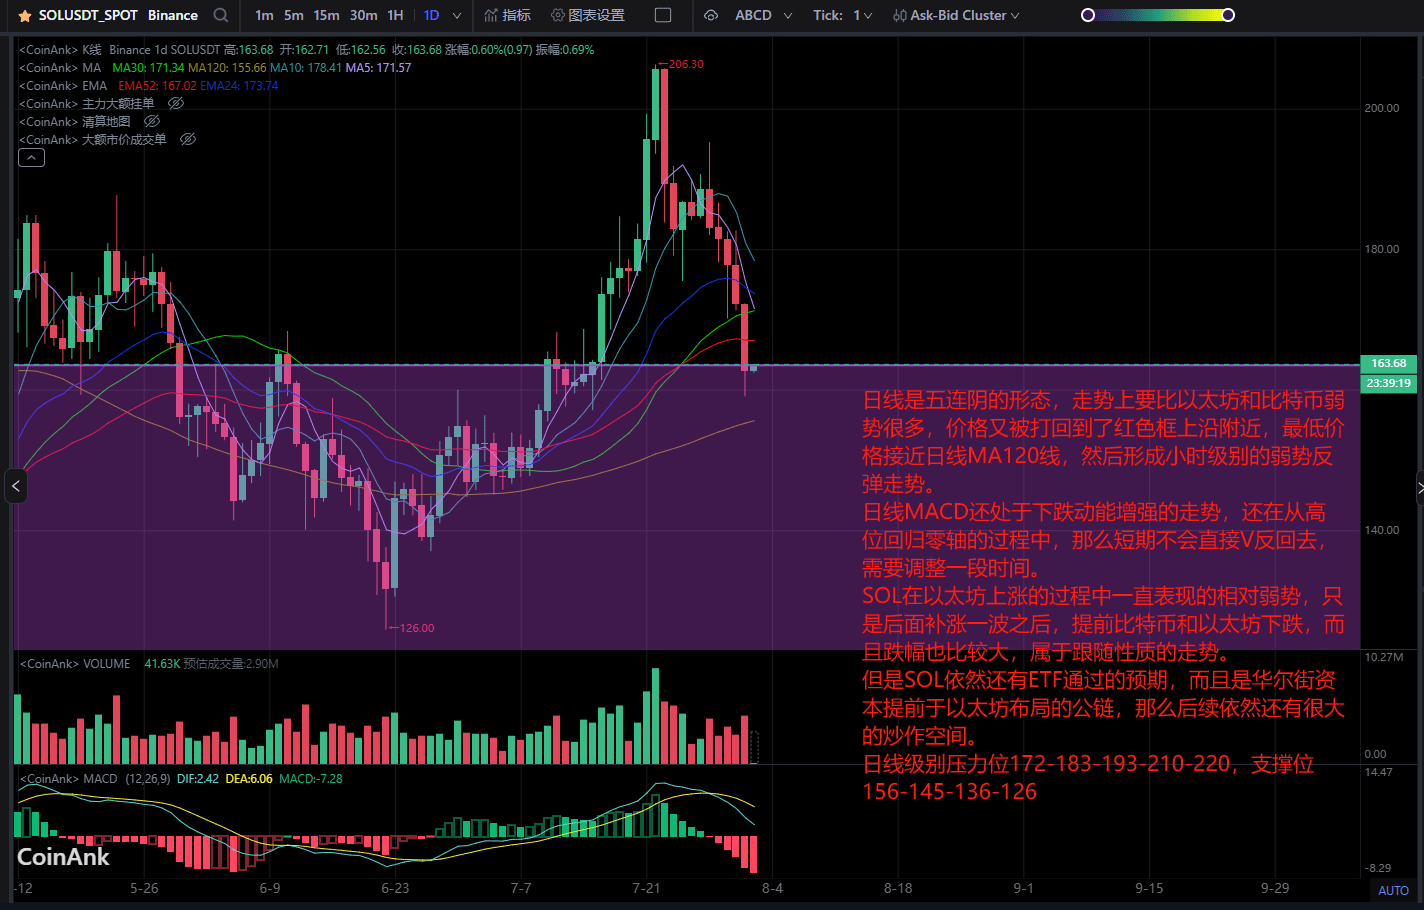
The daily chart shows a five consecutive bearish candle pattern, which is significantly weaker than Ethereum and Bitcoin. The price has been pushed back to near the upper edge of the red box, with the lowest price approaching the daily MA120 line, forming a weak rebound trend at the hourly level.
The daily MACD is still in a trend of increasing bearish momentum, and is in the process of returning from a high position to the zero axis, so it will not directly reverse in the short term and will need to adjust for a period of time.
SOL has been relatively weak during the rise of Ethereum, only experiencing a subsequent surge before falling earlier than Bitcoin and Ethereum, and the decline was also significant, exhibiting a following nature in its trend.
However, SOL still has expectations for ETF approval, and it is a public chain that Wall Street capital has positioned in advance of Ethereum, so there is still a lot of speculation space in the future.
Daily level resistance levels are 172-183-193-210-220, and support levels are 156-145-136-126.