The crypto market never sleeps—and $XRP
XRP/USDT's 15-minute chart is quietly brewing a storm.
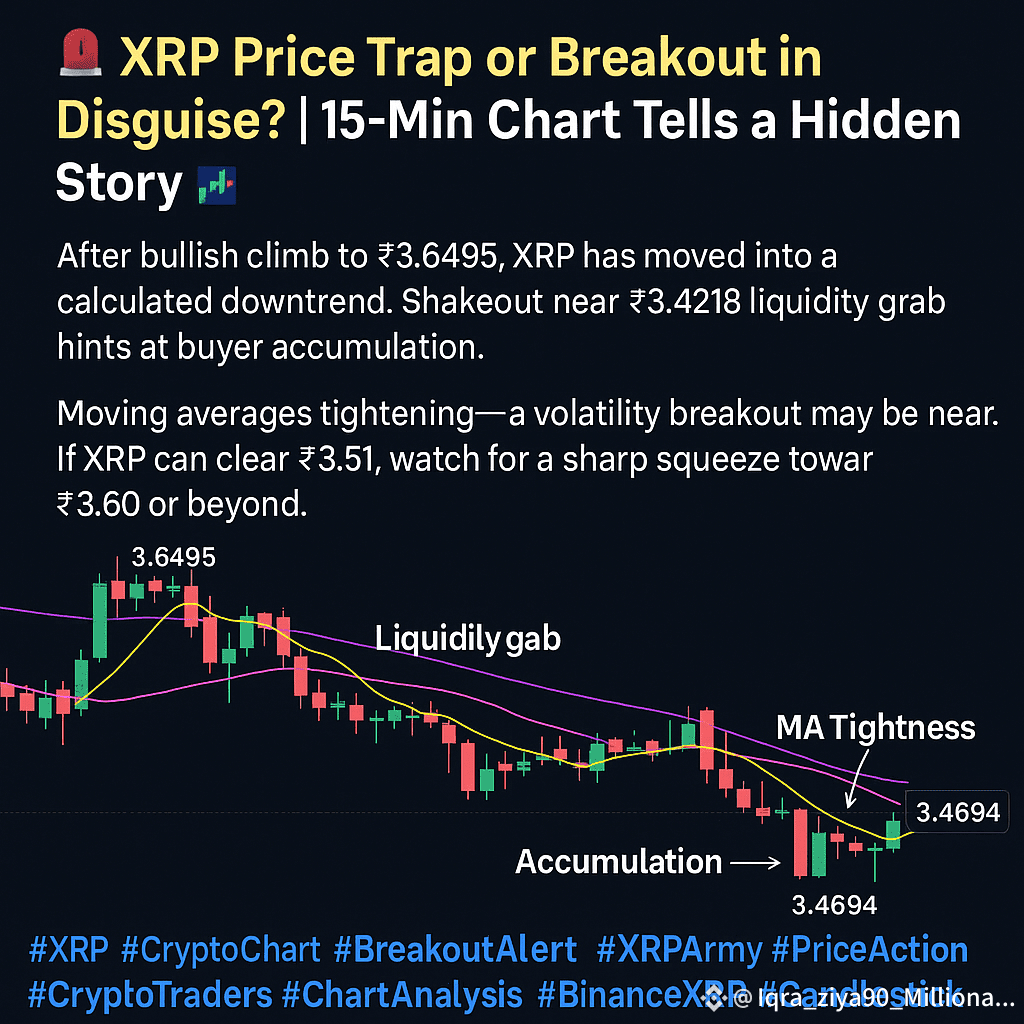
After a bullish climb to ₹3.6495, $XRP faced rejection and began a calculated downtrend. To the untrained eye, this looks like weakness. But smart traders know better—this is a setup.
🔍 At ₹3.4218, we witnessed a classic liquidity grab, where weak hands got shaken out before a bounce. The bounce wasn’t aggressive, but it was strategic—a sign that buyers are silently stepping in.
Now let’s talk moving averages:
The 7 EMA (yellow) is curling up,
The 25 EMA (pink) is flattening,
The 99 EMA (purple) is acting as dynamic resistance.
This trio often signals price compression before a move. And judging by the volume spikes, a volatility breakout might be near.
💥 If XRP can push and close above ₹3.51 with volume confirmation, we could see a sharp squeeze toward ₹3.60 or beyond.
🧠 Pro Tip for Traders:
“Smart money never chases pumps. It positions itself during dips.” This pattern shows a healthy consolidation with a potential trend reversal forming.
If the next candle breaks above the MA cluster and holds, this could be the start of a mini breakout rally.
📈 Chart Pattern Summary:
🔻 Drop after peak = Shakeout
🟢 Volume return = Accumulation
📊 MA tightness = Pressure building
🚀 Next move = Explosive if resistance is broken
#xrp #crypto #crypto #BinanceXRP #MarketSent#CandlestickPattern