$BTC surged early last week, hitting the $120K–$123K range before getting rejected near the 78.6% fib extension. Since then, it’s formed a symmetrical triangle on the 4H chart, a classic consolidation pattern before large breakout moves.
Technicals to watch
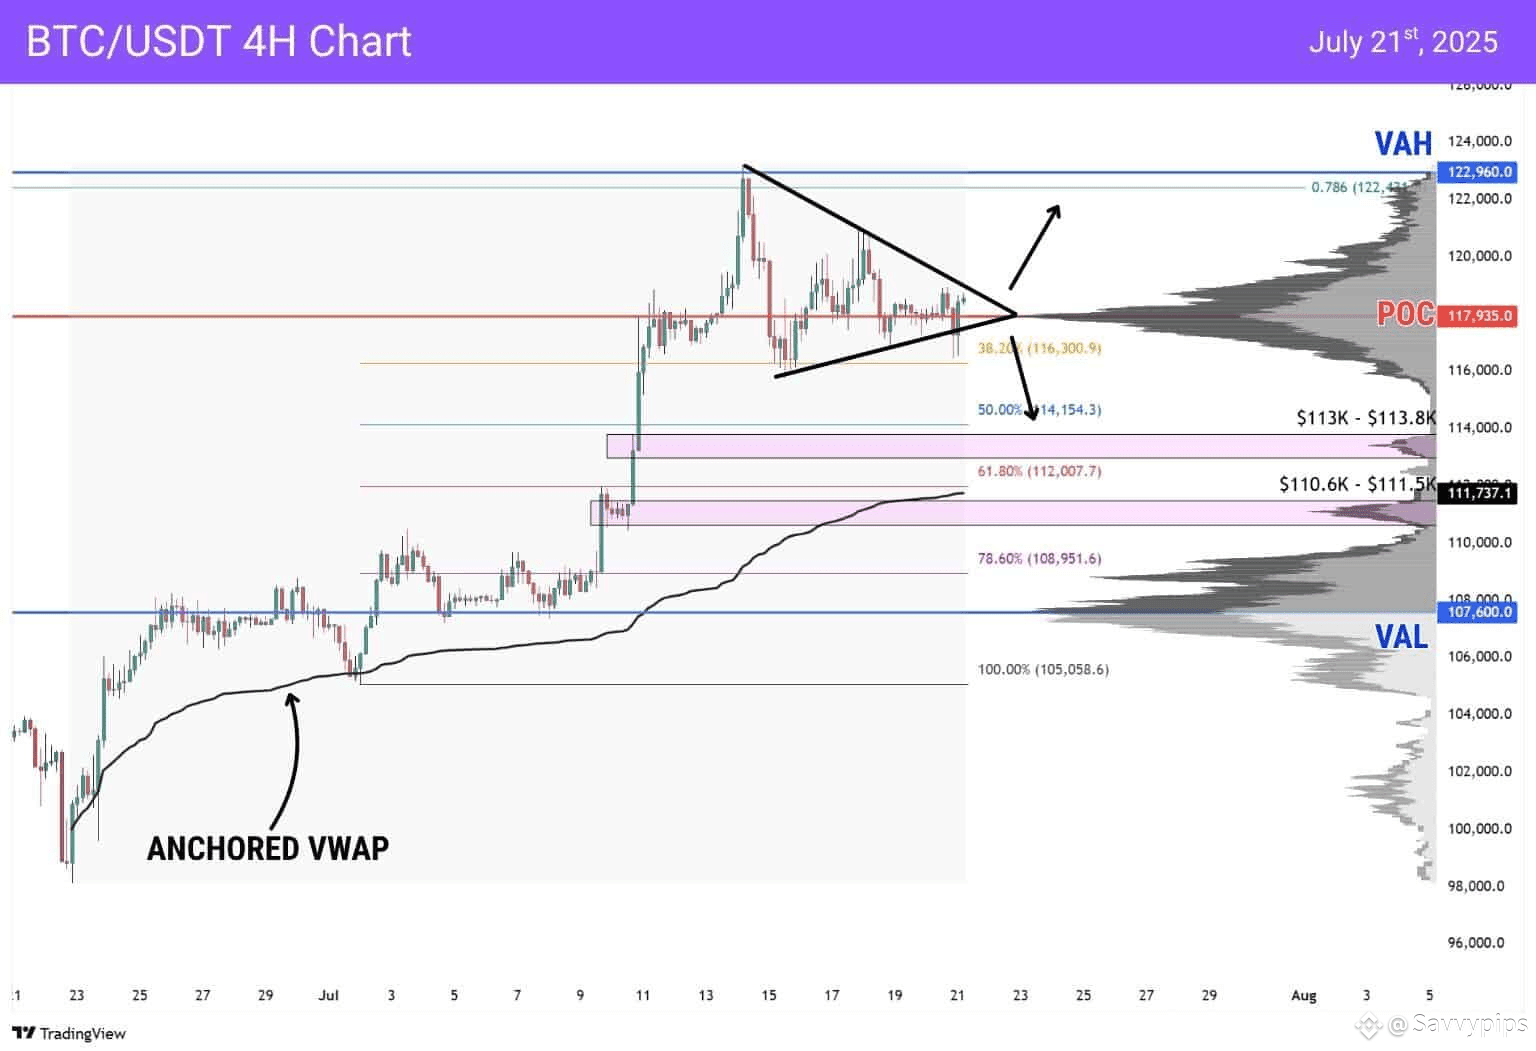
Measured move (UP): $126,000
Measured move (DOWN): $110,000
Reclaim needed: All-time high at $122,960
CME gap: $114.4K–$115.6K
High-volume node: ~61.8% fib, overlaps with $110K–$111K
Anchored VWAP from June lows aligns with $110K support
If $BTC price breaks out upward
It’s not enough to just pierce the ATH, it must hold above $122,960 with strength to avoid another fakeout.
If $BTC price breaks downward
The most logical path is: Fill the CME gap.
Drop into the 110K–111K area, where strong historical support and volume structure sit in confluence with the anchored VWAP.
A retest and hold of $110K could actually be bullish in. the mid-term, setting up the next leg.
#StrategyBTCPurchase #BTC #BTCanalysis #BTCvsETH #Write2Earn
