Today's observation: Has the distribution phase already started?
Yesterday there wasn't any major macro news.. Basically, it was just a few cryptocurrency-related bills officially signed into law.. Essentially, good news has landed, and there isn't much more room for speculation..
This weekend seems relatively calm for now, but today we can pay attention to on-chain analysis..
The day before yesterday, Glassnode published an on-chain analysis.. I won't do a full analysis, just mention a few key points worth noting:
1 When this wave came up, there was a massive amount of entry capital between 93,000–97,000 and 104,000–110,000.. (Combined, it should exceed 4 million coins, which takes up a lot of the circulating supply.)
This future will become a very strong support.. Those who missed the chance to get in during this wave of spot trading, and those who got in at 120,000 for a swing trade, will consider getting in again when it returns to these two positions..
2 After 120,000, there are no trapped positions in the short term, only profit-taking positions. At this time, the behavior of short-term traders is crucial for price impact. This chart is key (also the only one I think is key).
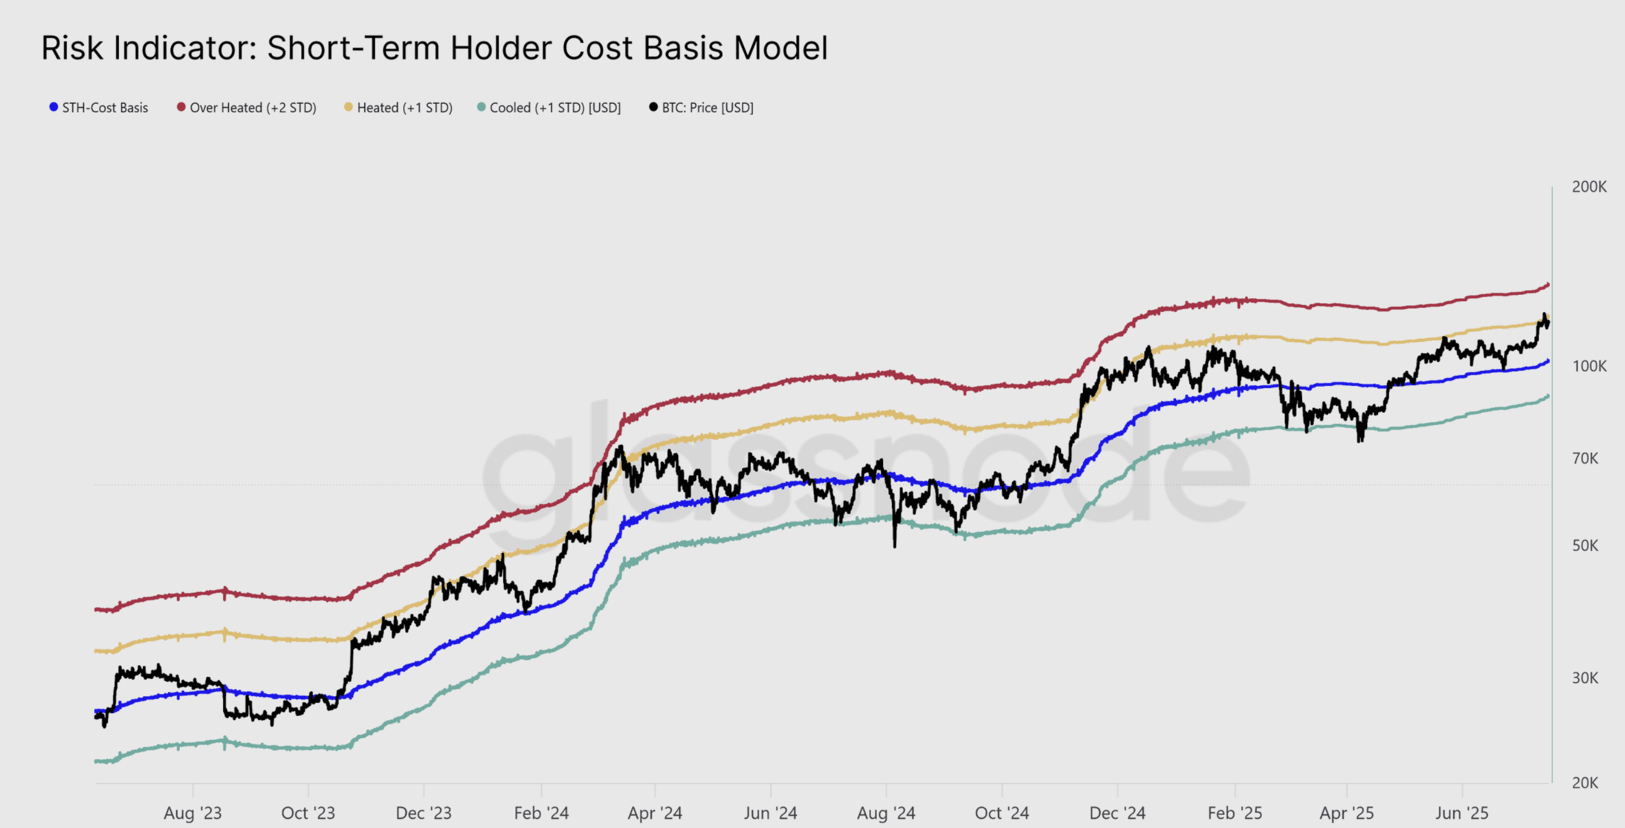
The yellow line represents the price that has risen above the cost of short-term holders by one standard deviation.. At this price level, many short-term traders will choose to take profits. From the historical chart since 2023, it can be seen that the yellow line has basically been suppressing the price. And this price of the yellow line corresponds to 120,000.
(This roughly counts as a historical psychological statistical model, that is, when short-term traders reach this level of profit, many will choose to sell. Thus, price suppression is formed.)
So this time after rushing to 120,000 and facing resistance can also be seen as a manifestation of this model..
And the real overheating frenzy is when prices reach double the standard deviation above the short-term traders' cost, which is represented by the red line in the chart. Since 2023, only around March-April has it briefly touched this red line level.. At that time, the price quickly peaked and adjusted sideways.
And this price of the red line, which is double the standard deviation, currently corresponds to around 136,000..
So now Glassnode's conclusion is that 120,000 is a short-term resistance feedback. We need to see the strength of the buying pressure going forward.. If buying pressure remains strong, the next resistance point will be around 130,000 (considering that it has not touched the red line before, it will be suppressed. Plus, 130,000 is a psychological barrier).
But if the buying pressure near the yellow line at 120,000 is not enough, then it may be that 120,000 will again be a scene suppressed by the yellow line.
In other words, there is still enough buying pressure to push to 130,000.. If buying pressure is insufficient, it will basically remain around 120,000 in the short term.
3 I won't go into detail on the remaining indicators.. The general conclusion is that short-term traders are starting to take profits, which historically is a sign that a top is beginning to form.. However, before the top is truly formed, if buying pressure is strong, it cannot be ruled out that there will be further upward momentum.. If it continues like this, based on various indicators, the pressure level is likely around 130,000.. (Psychological pressure at round numbers, profit pressure from short-term traders, historical statistics, etc.)
This analysis from Glassnode was published on Wednesday and does not include the situation from yesterday and the day before.. Since the day before yesterday, on-chain analysts have made more progress.
1 Last Thursday, a total profit of 4.3 billion dollars was realized in a single day.. (This means that so many people chose to sell here, turning floating profits into realized profits of 4.3 billion.) This has surpassed the peak of that bull market in November when Old Trump was elected. In November-December, the maximum single-day profit was only 3.5 billion.
This indicator shows that the distribution phase of taking profits on-chain has already begun.. But it should also be noted that historically, the start of the distribution phase does not mean a peak; historically, several rounds of peaks have occurred before a real top is reached.
2 Large whale transfers to exchanges recently peaked at 12,000 coins in a single day.. This is also a recent high (indicating that whales are transferring to exchanges to sell).
This is also an indicator that the distribution phase has begun...
Well, after reading these analysts' analyses, what have you gained? It seems very reasonable.. But does it provide complete guidance for operations?
On-chain indicators are like this; forming a peak is a process, and it won't mean that the price will immediately drop just because one or two indicators appear.. However, when these indicators keep appearing, the peak gradually forms..
If it needs to correspond to operational guidance, I can roughly understand it as follows: between 110,000 and 120,000, there should still be capital games.. It still needs to shake back and forth.. Distribution is distribution, entry is entry.. It may still push towards the high of 123,000, but each time it approaches here, there should be a wave of selling pressure realizing profits above 4 billion..
In the short term, within 1-2 months, we can expect 130,000. (For example, leveraging the speculation of interest rate cuts in September) However, without a significant correction, the expectation of reaching 140,000 or 150,000 without resistance is unrealistic..
That's about it..
Let's review yesterday's operations.. Yesterday I tried a new, more aggressive trading method and entered at three low long points.. The first entry was at 119,100 and I lost 300.. The second entry was at 118,400, but later I had to go out and couldn't monitor the market, so I closed the position (also because the first trade was a loss, it affected my mindset, and I didn't want to lose two trades in a row). I came back to find that I could have actually made 1,000 points. The third entry at 117,200 also made 1,000 points and I exited.. Overall it was okay, but I don't really like this method, so I'll stick to the previous approach..
From the perspective of liquidation liquidity, the accumulation of short positions is above 118,500.. (From yesterday's rebound, it did not break through 118,300, where short positions accumulated.) Looking further up, it's above 120,000..
Further down, there is still a huge accumulation below 115,500..
(I am already imagining the scenario of clearing a wave of liquidity here on Sunday midnight..)
From the orders, the large buy order that was previously at 114,500 has now moved to 115,000.. There is still support here (overlapping with spot buy orders + liquidation + transaction vacuum zone, etc.) At the same time, there was a medium-sized sell order of 900 coins at 117,000 yesterday.. After a spike in liquidity in the middle of the night, this order was filled, and a rebound occurred.. This was also mentioned in the group in advance yesterday..
Currently, there are small sell orders at 118,300 in the spot market.. (A small order has suppressed the price for 3-4 hours, and liquidity is indeed poor over the weekend.) Further up, there are small sell orders at 120,000, and large sell orders still remain at 125,000.
Below, there are still small buy orders at 116,000 and medium buy orders at 115,000..
Finally, today’s thought... 117,800~118,300 aggressive shorts feel worth trying.. If it breaks below 118,600, just get out. It’s about the psychological resistance level here + spot sell orders + yesterday's rebound high + breaker block + yesterday's dense trading area. Just take a bite of 500-1000 points and run.
Upwards, the high short position below 120,000 is also worth a try.. Here are the spot sell orders + breaker block.. If it breaks above 120,000 and stabilizes, get out. But this place was already preemptively sold off when it was at 119,500.. It’s uncertain whether it can break through 119,500 again, but I also don't want to place a limit order at 119,500 in advance, as the stop loss would need to be over 1,000 points.. So I'm planning to just place an order below 120,000, at worst I won't get filled.
For low longs, an aggressive entry can be at 117,000 to 116,800, the previous low from early this morning hasn't been tested + the dense trading area from Tuesday.. Worth 1,000 points. If it breaks below 116,800, just get out.
Further down is the range between 116,000 and 114,200.. This week I've mentioned it many times, let's see if there will be opportunities on Sunday morning.. Why is this range so wide? Because of multiple overlapping factors..
Long liquidation liquidity starts below 116,000.. It continues until around 115,000.. If it really liquidates, it might spike slightly, touching around 114,000 is also possible.. 114,000 is a continuous transaction vacuum zone.. There will also be a huge amount of chips entering here.. Unless there is a major event, it is difficult to drop below 114,000 in one go..

