🕘 Update at 09:00 AM – July 18, 2025
$ETH I am quite surprised by the rapid acceleration of it. The price surged to 3.628 USDT, surpassing the previous strong resistance without looking back. However, contrary to the excitement, I am also a bit cautious because many indicators suggest that ETH has increased too quickly. Let's go through each timeframe to take a closer look:
🕓 4h timeframe – Strong breakout, but RSI is hitting the ceiling
On the 4h timeframe, ETH just had an impressive breakout after many sideways sessions around the 3.400 area. This breakout pushed the price up close to the previous peak from June. Notably, the bullish candle is very decisive, with high volume, and MA7 – MA25 is expanding strongly in a positive direction.
However, the RSI(6) indicator has risen to 87 – a number that indicates ETH is falling into an extremely deep overbought zone. The MACD is still expanding upward, with no signs of weakness yet, but I think after such a sprint, ETH could very well "release pressure" a bit to maintain balance.
=> For me, the 4h is a strong upward trend but starting to need caution. If ETH cannot hold the 3.580 – 3.600 range, it might turn around for a slight correction.
⏱️ 1h timeframe – Money flow is pouring in strongly
The 1h chart shows that ETH has maintained a continuous upward trend from the 3.490 area to the present. The MA lines are in the correct increasing order (MA7 > MA25 > MA99), confirming a clear upward structure. The RSI(6) indicator is at 90.35 – very high, but there is no strong reversal signal yet.
The MACD is very beautiful, with the MACD and signal lines expanding, and the histogram continues to be positive and rising → money flow is still pushing the price up.
=> In my opinion, the 1h is showing that ETH still has the potential to continue rising, but is likely to experience slight fluctuations around the 3.620 – 3.630 area due to profit-taking pressure.
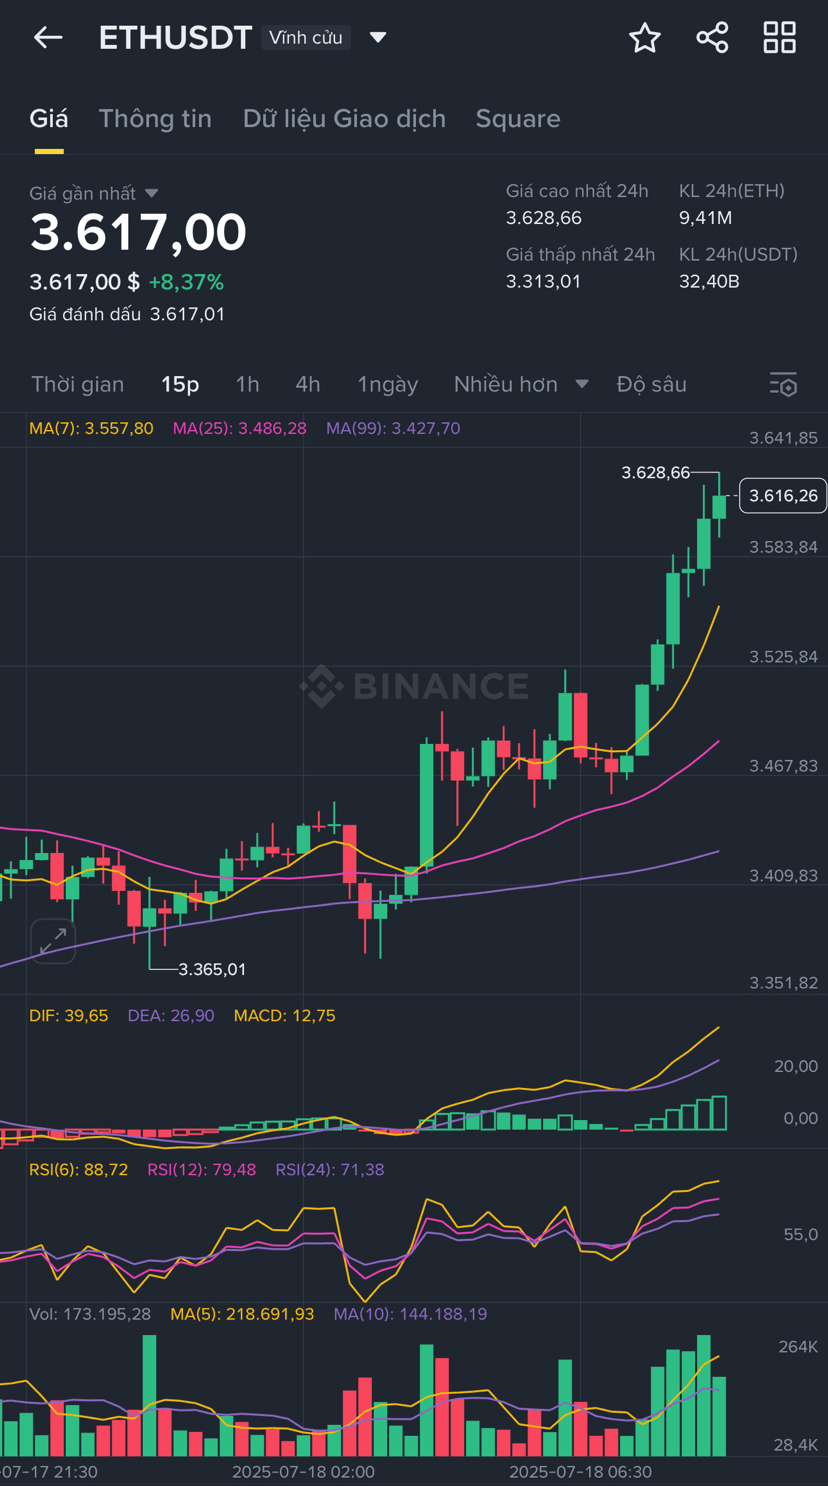
🕒 15m timeframe – Clearly overbought, prone to short-term fluctuations
On the 15-minute timeframe, ETH has risen very quickly, almost without any clear correction. The RSI is currently at 88.72, indicating that the market is in a heavily overbought zone. Although the MACD still maintains good expansion, there are signs of slowing down in the last few candles.
This makes me think that ETH might be about to enter a temporary "rest" phase to regain strength. If the price stays above the 3.605 area, there is no problem, but if it breaks this area, there could be a slight correction down to 3.580 – 3.590 before bouncing back up.
📌 Summary of personal view:
ETH is showing a very strong upward trend across all 3 timeframes. Especially the 1h shows that money flow is coming in steadily, not weak at all. However, both the 4h and 15m signal that the RSI is already too high, so I believe there will be a slight correction to balance the pace.
If ETH can hold above the 3.590 – 3.600 range, it is likely to continue breaking 3.630 to aim for 3.670 – 3.700. But if it fails and breaks the nearest support range, ETH may test back to 3.550 – 3.565.
🚀 The scenario I am monitoring:
🔸 Bull case: ETH maintains above 3.605 – breaks 3.630 → near target is 3.670
🔸 Bear case: Short-term profit-taking pressure → correction to 3.560 – then bounce back
👇 What does everyone think about this rise of ETH? Is it the beginning of a new wave or just a short-term pump before it deflates?
Let's share! 💬