In trading (especially technical analysis), support lines, resistance lines, and trend direction are important concepts to help determine the best time to buy or sell.
Here is the explanation along with a simple chart image:
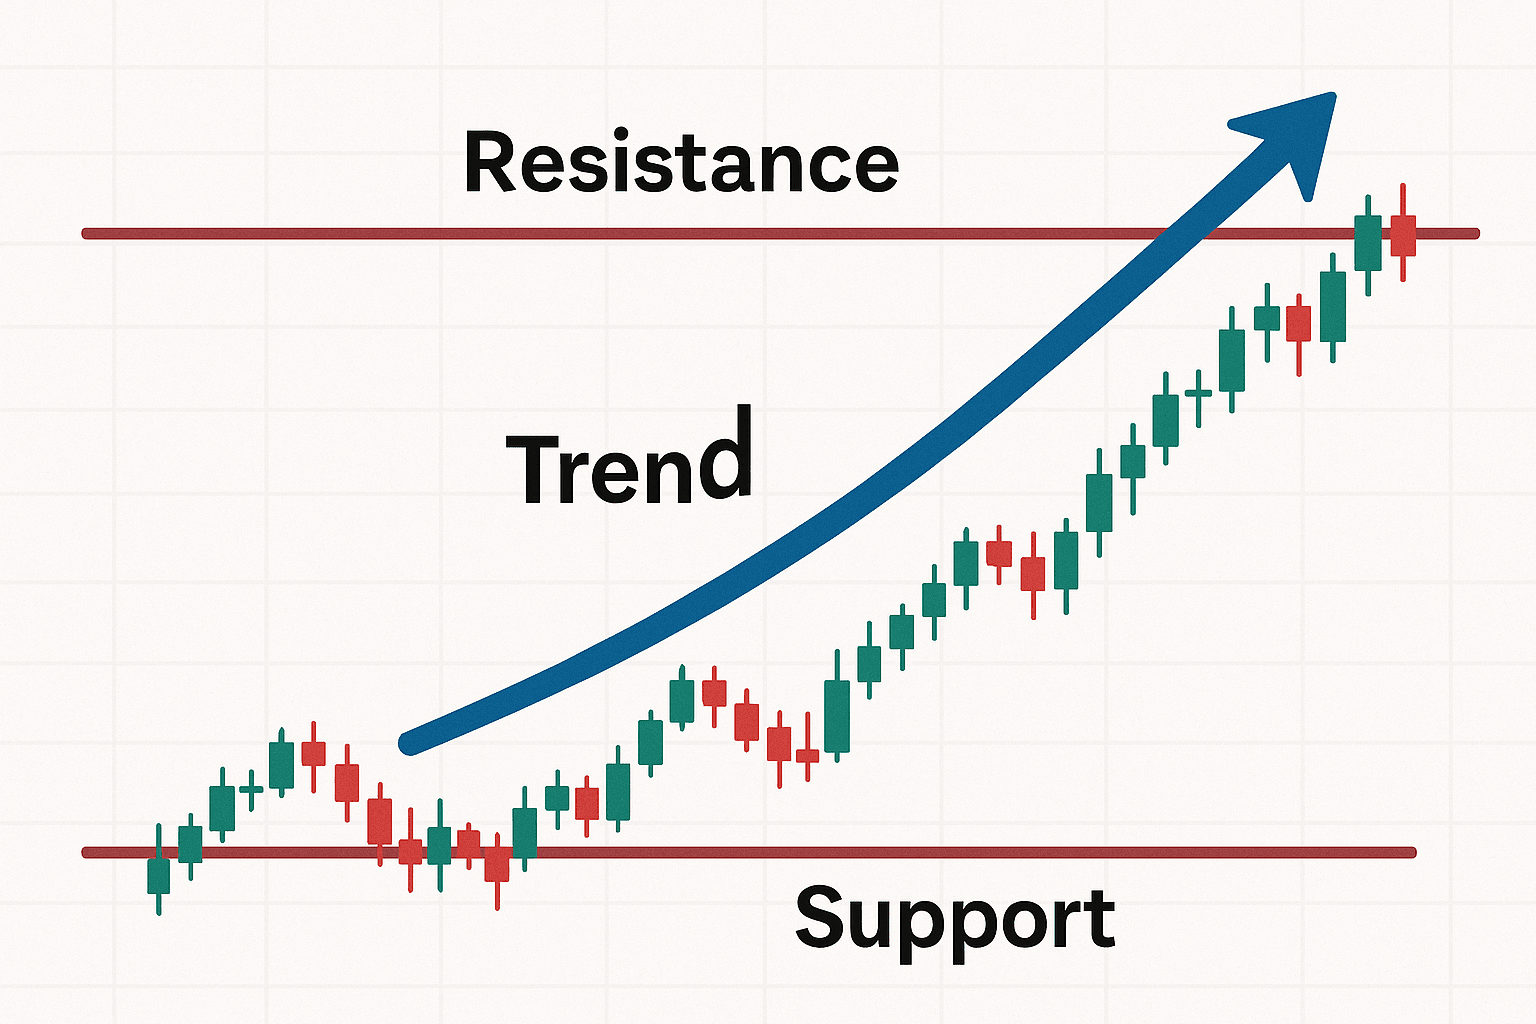
📉 1. Support Line
The support line is the lowest price level that tends to hold the price from falling further.
Usually, many buyers enter at this level, causing the price to bounce back up.
Example:
Prices drop to 100 $USDT then always bounce back up → so 100 is support.
📈 2. Resistance Line
Resistance is the highest price level that tends to hold the price from rising further.
Many traders sell at this level, so the price often bounces down.
Example:
Prices rise to 150 $USDT then always drop again → so 150 is resistance.
📊 3. Trend Direction
Trend direction indicates where the price movement is generally headed:
Uptrend: Prices continue to rise (higher high & higher low)
Downtrend: Prices continue to fall (lower high & lower low)
Sideways: Prices move flat (no significant rise/fall)
#TradingBasics #TrendAnalysis #CryptoEducation #AnalisaTeknikal #BelajarTrading