Having the way without the technique is still seeking the technique. The way is the principle; the principle is unquestionable. Based on our understanding of the rules in the cryptocurrency world, we find the direction for corporate development through the big picture. At this time, we must apply market psychological analysis, continuously pondering the market's psychological state, thereby identifying the emotional market's freezing point for buying, while finding the emotional market's peak to facilitate selling.
Having skills without principles stops at skill. Emotions are entirely built on the perspective of the larger framework within the cryptocurrency rules. It is a fluctuation of price around value; purely discussing the fluctuation of emotions will lead one into an elusive process, as human sentiment is the most unpredictable. Without a foundation of value, speculating on changes in human sentiment is very dangerous. We must find value as our anchor to leverage the fluctuations of emotional cycles and improve our investment returns.
Unity of the way and technique. The unity of the way and counting means we need to find the rules of the stock market from a broader perspective. These rules allow us to clearly identify the value of a company. Then, by understanding emotional cycles, we can find some patterns of price fluctuations around value. This helps us quickly identify the emotional freezing point, allowing us to enhance investment returns and rapidly grow wealth.
Having been in the cryptocurrency space for 10 years, I can now trade cryptocurrencies to support myself! Regardless of market conditions, I always insist on knowing the trend trading method of candlesticks, which has been etched in my mind and become subconscious! If you can achieve this, you can also treat trading cryptocurrencies as a semi-profession, saving yourself years of detours. Make sure to save this!
Profits and losses often differ little, just a thought apart! Yet most people are still paying the 'intelligence tax'! Today, I will break this layer of glass for you, allowing you to awaken from your dream! After this, retrieve all that you have lost. What follows is all essential information, cutting straight to the point:
Preface: Candlesticks represent yin and yang, the rise and fall, a universal law in nature and human society. The cryptocurrency world is no different; when good things reach their peak, they turn to bad, and vice versa. This is the essence of everything, the result of the yin-yang struggle. Candlesticks are not the only means, but to survive in the cryptocurrency market, investors must combine practical experience, improve themselves, and refine their skills.
Candlestick Basics:
The candlestick chart, also known as the candle chart, originates from Japan's Tokugawa shogunate era, where it was used by rice merchants to record market conditions and price fluctuations. Later, due to its detailed and unique drawing method, it was introduced into the capital market.
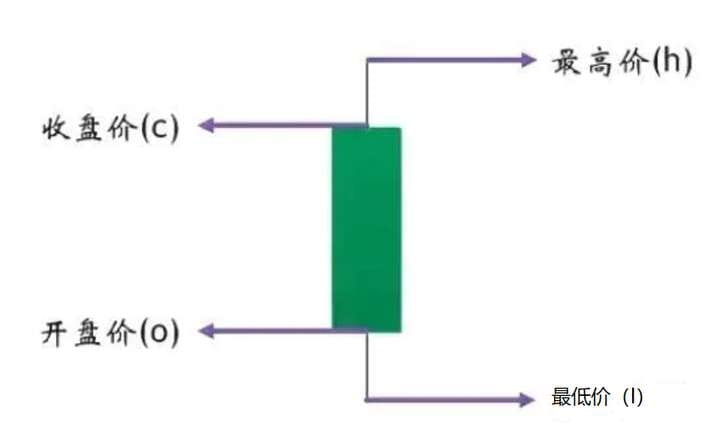
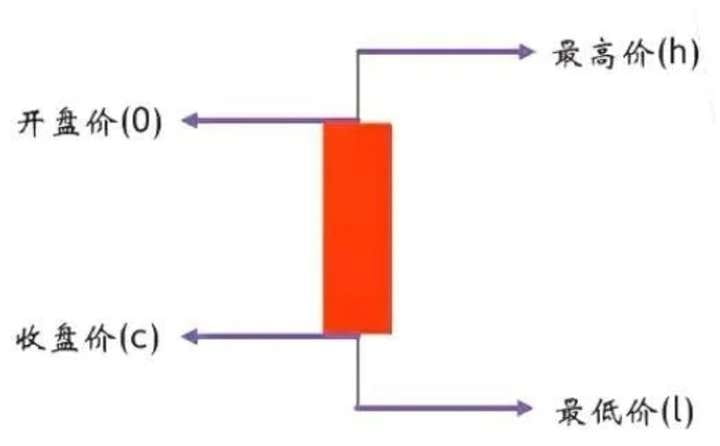
Candlesticks are drawn based on each analysis period's opening price, highest price, lowest price, and closing price. The structure of a candlestick can be divided into three parts: upper shadow, lower shadow, and body.
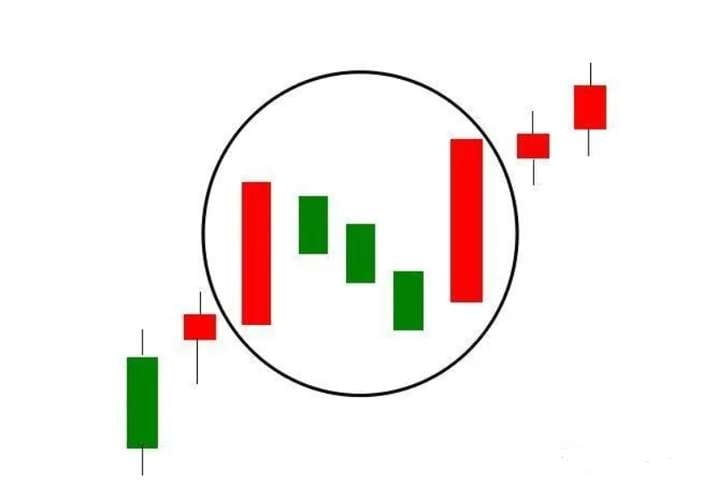
In the digital currency market, green represents bullish, and red represents bearish. Through candlestick charts, we can completely record the performance of the cryptocurrency market for each analysis period. After a period of price consolidation, a special area or shape is formed on the chart, with different shapes indicating different meanings. We can explore some regularities from these shape changes. Generally speaking, candlestick patterns can be divided into reversal patterns, consolidation patterns, gaps, and trend lines, etc.
The practical significance of candlesticks:
In cryptocurrency trading, candlestick charts are the most intuitive analysis tools. A falling leaf indicates the autumn of the world, which is the mindset that candlestick charts bring us. Simple candlesticks remind us that no matter how the cryptocurrency market operates, we can find clues in the details. Those who can grasp the clues revealed by candlesticks faster and more accurately can avoid greater losses and thus obtain larger profits.
However, in reality, different people will have different 'views' on candlesticks. Therefore, the same candlestick chart presented to numerous investors can yield a multitude of different analyses. It is precisely such results that make the competition in the cryptocurrency world more intense. Sometimes, when doing quantification, or trading too much, one gradually discovers that often candlesticks can be misleading and atypical. Thus, every day is filled with frustration, wondering how it could be like this.
It shouldn't be like this! Theoretically, it should go this way or that! Gradually starting to doubt candlesticks, studying the manipulators, researching false breakouts, and so on. Conspiracy theories permeate the entire accumulation stage. Sometimes, it may be luck; a few contrarian actions or mere speculation may yield some results, making one feel like they have truly found the essence behind candlesticks, believing they have truly grasped the market's pulse. But more often than not, just like in the previous stage, one still fails to achieve good results after quantification. Many people die at this stage, stuck in place, hesitant to move forward. But once you truly pass this stage, you'll discover.
Whether you believe it or not, candlesticks operate this way. Whether you trade or not, they are there. They are neither divine nor garbage. They are merely witnesses to the market's trajectory. There is no need to mythologize them, nor to despise them.
The interpretation of candlesticks has become increasingly complex, as the progress of the investment community and the growth of investment funds often lead to short-term candlesticks being manipulated and creating 'traps'. Therefore, we need to use relative principles and technical analysis methods to filter them out. The principle of relativity includes quantitative measurement standards and analysis work, allowing us to increase the probability of successful analysis and operation. Without candlestick charts, investment is still investment, and the journey remains tortuous. Other methods can still be used. However, when facing the investment reality we are in, the thoughts around candlesticks cannot be ignored, as they are one of the starting points of real investment to some extent.
Many people firmly believe that the premise of candlesticks is: the market is always right. Therefore, when observing a certain candlestick formation, because the market is always right, what the current candlestick reflects will also be the future trend of the market. In fact, I believe that many individuals who have just started trading will have a question: why, when the market shows a perfect technical formation, does it often go against expectations? This is not a fault of the technique itself nor an issue with the user's application; it is merely that we often only see the 'perfect' technical formations, and we only see what we believe is correct.
Analysis of various basic shapes of individual candlesticks:
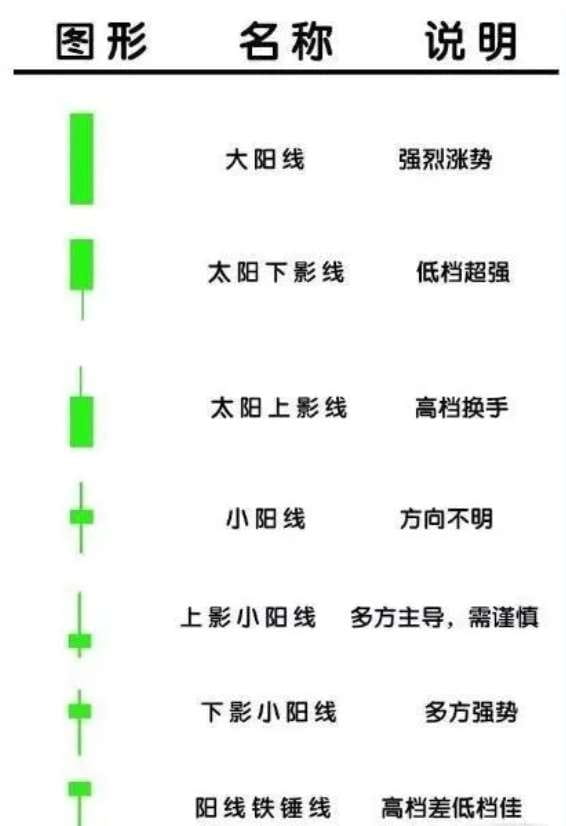
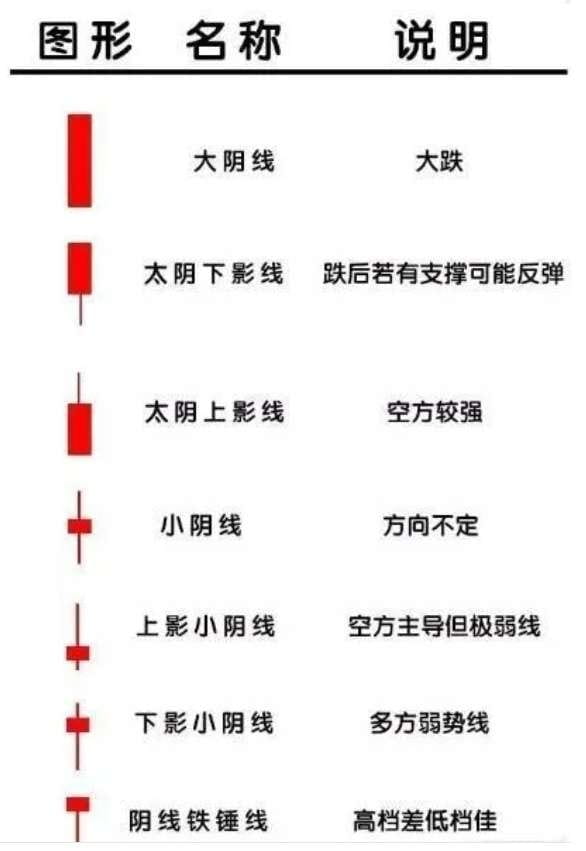
Look at yin and yang: that is, look at the direction. Taking a bullish line as an example, after a period of struggle between bulls and bears, when the closing price is higher than the opening price, it indicates that the bulls are in the lead. According to Newton's laws of motion, in the absence of external forces, prices will continue to move in the same direction and speed. Therefore, a bullish line suggests that the next phase will continue to rise, at least ensuring that the initial phase of the next stage will push upward. Hence, a bullish line often indicates a further rise, which aligns perfectly with one of the three major assumptions of technical analysis: stock prices fluctuate along trends, and going with the trend is also the core idea of technical analysis. Similarly, a bearish line suggests continued decline.
Look at the size of the body: The size of the body represents the intrinsic momentum; the larger the body, the more obvious the trend of rising or falling. Conversely, the trend is less clear. Taking a bullish candle as an example, its body is the portion where the closing price is higher than the opening price. A larger bullish body indicates stronger upward momentum, similar to how larger mass and faster speed lead to greater inertia. A larger bullish body signifies greater intrinsic upward momentum, and its upward force will exceed that of a smaller bullish body. Similarly, a larger bearish body indicates stronger downward momentum.
Look at the length of the shadows: The shadows represent reversal signals; the longer the shadow in one direction, the less favorable it is for the stock price to move in that direction. For instance, a longer upper shadow is less favorable for the stock price to rise, while a longer lower shadow is less favorable for the stock price to fall. Taking the upper shadow as an example, after a period of struggle between bulls and bears, the bulls finally lose ground. Once bitten by a snake, one is afraid of well ropes for ten years. Regardless of whether the candlestick is bullish or bearish, the upper shadow has already formed the upper resistance for the next stage, making the probability of the stock price adjusting downward quite high. Similarly, a lower shadow indicates a higher probability of the stock price attacking upward.
Describing the market with candlesticks has a strong visual impact and is one of the charts that best reflects market behavior. Nevertheless, some common candlestick combinations are merely summaries of typical shapes based on experience, lacking strict scientific logic. When using candlesticks, keep the following points in mind!
1. There will be a certain error rate in candlestick combination analysis. Market fluctuations are complex, and the actual market situation may differ from our judgments. Statistical evidence shows that the success rate of using candlestick combinations for future market predictions is not very high.
2. Candlestick analysis methods must be combined with other methods. After making a decision on whether to buy or sell using other analytical methods, only then should you use candlestick combinations to choose the specific timing and price to take action.
3. Continuously 'modify, create, and adjust' combination patterns according to actual conditions. Combination patterns are merely products of summarizing experiences; in the real market, it is rare for situations to completely meet the candlestick combination patterns we describe. If one rigidly applies combination patterns without change, they may miss suitable opportunities for a long time. It's essential to adaptively change combination patterns based on circumstances.
You should understand the internal and external principles of each combination pattern. Because it is not a perfect technique, this is the same as with other technical analysis methods. Candlestick analysis is established based on human subjective impressions and is one of the analytical methods expressed based on historical pattern combinations.
The biggest point in trading cryptocurrencies is maintaining a good mindset; technique comes second. Be sure to pay attention to the following eight iron rules!
1. In most cases, Bitcoin is the leader in the cryptocurrency market's rise and fall. Occasionally, robust coins like Ethereum may break away from Bitcoin's influence and develop a one-sided trend, but altcoins generally cannot escape its impact.
2. Bitcoin and USDT move in opposite directions. If you notice USDT rising, be wary of Bitcoin falling; when Bitcoin is rising, it is a suitable time to buy USDT.
3. Between 0:00 and 1:00 AM, pinning anomalies are likely to occur. Therefore, domestic coin friends can try to set a low buy price for their desired coins and a high sell price before going to bed. Who knows, it might just get executed while you sleep.
4. Every morning between 6:00 and 8:00 AM is a critical time for judging buy or sell opportunities, as well as for assessing the day's rise and fall. If it has been falling from 0:00 to 6:00 AM, and continues to fall during this time, it is a good opportunity to buy or add to positions, and the day is likely to rise. Conversely, if it has been rising from 0:00 to 6:00 AM, and continues to rise during this time, it is a selling opportunity, and the day will likely fall.
5. 5 PM is an important moment of attention in the trading community. Due to time zone differences, American coin friends will be up and about, which may trigger fluctuations in coin prices. There have indeed been significant rises or falls at this moment, so pay special attention.
6. There is a saying in the cryptocurrency world about 'Black Friday', with several instances of significant declines occurring on Fridays. However, there are also cases of significant rises or sideways movements, so it's not particularly reliable; just be slightly aware of the news.
7. If a cryptocurrency with a certain trading volume declines, don't worry; patiently holding will surely lead to a recovery, whether it takes a short 3-4 days or a longer month. If you have spare USDT, supplement your positions in batches to lower the price, which will expedite your recovery. If you don't have spare funds, just wait; it won't disappoint you, unless you really bought I coins.
8. Holding the same coin for long term while trading in spot markets yields greater returns than frequent trading; it just depends on whether you have the patience to hold. I bought Dogecoin at 0.089 and have seen it multiply over 20 times until now.
Words of encouragement:
If you are new to the market, come to me, and I will teach you to learn while trading; if you are already in it but not doing well, come to me, and I will help you, ensuring you won't make the same mistakes again; if your positions are trapped, I will provide reasonable solutions based on your entry points. Since everyone has different trapped points, the solutions will also vary; some are suitable for conservative investors, while others are for aggressive investors. I will definitely use the most suitable methods to genuinely solve your problems and assist you in exiting.
Even the most diligent fisherman does not venture out to sea during a storm, but instead diligently protects his fishing boat. This season will pass, and a sunny day will come! Follow Yan An, who will teach you not just to fish but also how to fish sustainably. The doors of the cryptocurrency world are always open; going with the flow allows you to have a harmonious life. Save this in your heart!
