Let me tell you a story. When I suffered the most losses, I had a contract explosion of 2 million within three days, drowning in debt, almost losing my family and life. But the cryptocurrency world is so magical; by chance, I received guidance from an expert. In a stormy night, I realized that I had to start from scratch and become a full-time trader, becoming a professional cryptocurrency trader, studying technology rigorously, spending thousands of days and nights researching and learning!
The path in the cryptocurrency world is long, and I hope everyone can take fewer detours and avoid tragedies! I have achieved financial freedom and have been persistent in creating content on Zhihu. Many people do not understand why I continue to do this after achieving financial freedom and reaching several small goals. I have also asked myself the same question. In the process of rediscovering my original intention, on one hand, it is for my dream of being a hero; I have dedicated everything to trading, and I do not want my exceptional skills to go unnoticed! On the other hand, I want to provide a pathway for those who are eager to learn. What I have gained in the market is now a process of giving back; the way of nature. I recall the struggles I faced for over half a year due to leverage issues, and having no reference path to learn from; I could only repeatedly analyze the K-lines, day after day, night after night. Having crawled and struggled to this point, I deeply understand the hardships faced by retail investors in the cryptocurrency world and can empathize more.
In addition to solid technical sharing, I also strictly adhere to the following nine ironclad trading rules:
1. Avoid revenge trading.
When a trade is closed, regardless of profit or loss, one must resolutely abide by the rules. After executing a stop-loss, try not to look at it again within 24 hours. This can effectively avoid revenge trading; opening positions with a vengeful mindset is likely to worsen losses. Some believe in getting back up where they fell, but it is more important to calmly observe until new entry conditions are triggered. Since traders look at charts for several hours daily, it is difficult to resist the temptation to open new positions to recover after a stop-loss. This mindset needs to be avoided, especially when using leverage for swing trading.
2. Avoid participating in trading during weekends.
Every weekend, the volatility of cryptocurrency prices increases, and trading volume is very low. This makes it difficult to predict short-term price movements. The reason is simple: weekend buy and sell orders are usually small, and market liquidity is low, making it easier for whales to manipulate short-term prices, which makes the disadvantages of retail traders even more pronounced. Furthermore, since the cryptocurrency market operates 24/7, the trading intensity is much higher than that of the stock market, and weekends are good opportunities to relieve stress and rest because life is greater than trading.
3. Maintain trading at specific times.
As mentioned earlier, the cryptocurrency market operates 24/7 without stopping, and even full-time traders cannot keep staring at the screen all the time. To maintain a clear mind, you can set fixed trading times for yourself. After opening positions during trading hours, set stop-loss and take-profit levels, then you can go do other things. This eliminates the impulse to constantly check your phone or study the K-lines, and trading won’t affect your normal life.
4. Do not develop feelings for a particular asset.
If you fall in love with the asset you are trading, it can easily lead to poor decision-making. Excellent traders make money through efficiency and rules, giving themselves an advantage because most people's trading behavior in the market is driven by emotions. "Be a trading machine without emotions" can ensure decisiveness and principle in trading. Many traders suffer heavy losses, and one important reason is their emotional attachment to certain specific altcoins, teams, or projects. This is acceptable for medium to long-term investors, but it is a potential disaster for short-term traders.
5. Maintain simple trading rules.
Traders typically combine various indicators, news, and K-line patterns in an attempt to find suitable trading convergence points. There is nothing wrong with this in itself, but care must be taken to avoid over-analysis, which complicates matters. In fact, when a K-line pattern suitable for one's own system appears on the chart, trading can begin. At the same time, it is crucial to set proper stop-loss levels and position control.
6. Trade only with the correct mindset.
When you feel angry, tired, or stressed about something, do not trade; your mindset will affect your judgment. The key to maintaining a good mindset is to have other daily activities outside of trading. Activities like exercising, reading, and spending time with family and friends can help cultivate the right trading mentality.
7. Record trading diary.
Trading diary reviews can be tedious, but they are actually very meaningful because they can help you avoid making the same mistakes. There are specific reasons behind both profitable and losing trades, and recording trading details is a way to learn and can help you grow quickly.
8. Do not attempt to catch falling knives.
"Catching falling knives" refers to traders attempting to bottom fish for assets in freefall. The motivation to catch the bottom is often to lower the average cost price and offset losses caused by sharp declines. Attempting to accurately catch the bottom during a plunge is unwise. It is a more robust approach to wait for stabilization and rebound, and for resistance levels to turn into support before entering.
9. Do not ignore extreme market conditions.
While referring to technical analysis indicators, one must not ignore black swan events or other extreme market conditions. Ultimately, the market is driven by supply and demand, and sometimes the market is extremely unbalanced.
These valuable pieces of advice are the wisdom crystallization of years of practical experience and are worth serious consideration and strict adherence. I hope these suggestions can help everyone take fewer detours in the market and steadily move towards success.#山寨币突破
Today's focus is on a simple yet very effective cryptocurrency trading strategy - various indicator strategies (with MACD being the most important).
Without further ado, let's get straight to the point.
Secret One: The most practical and highest winning rate technical indicators I only look at these: (suitable trading techniques for beginners).
1. Trading volume refers to the specific transaction quantity within a certain time, including daily, weekly, monthly, and even 5-minute, 30-minute, and 60-minute charts. Trading volume is the core content of the entire market and can reflect fund flows. Each unusual movement in trading volume is a precursor to price changes, and higher trading volume indicates higher fund attention.
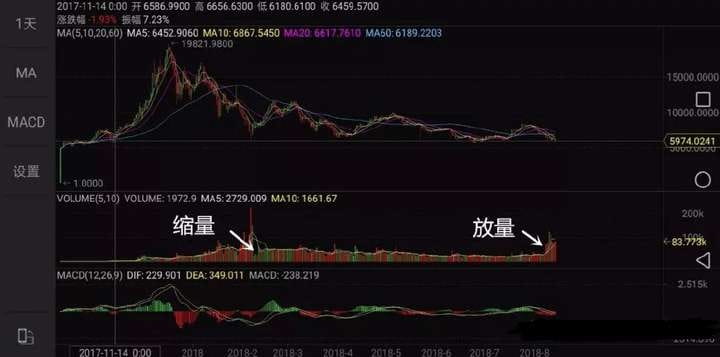
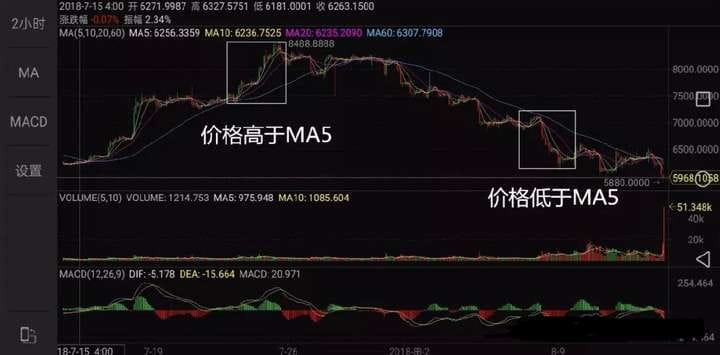
Taking the MA5 moving average as an example, a volume above the MA5 reflects increased activity, while a volume below the MA5 reflects reduced activity. When breaking up through MA5, it indicates high market sentiment; conversely, it indicates a cooling market.
2. KDJ - Stochastic Indicator.
The KDJ indicator, also known as the stochastic indicator, is a relatively novel and practical technical analysis tool. It was initially used for analysis in the futures market and later widely applied to short-term trend analysis in the stock market. It is one of the most commonly used technical analysis tools in both futures and stock markets.
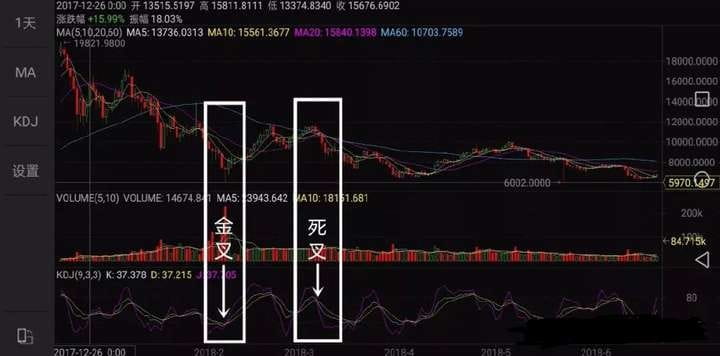
The KDJ indicator reacts relatively quickly and is suitable for short-term overbought and oversold situations in the market. The indicator has lag, and can be a reason for buying or selling cryptocurrencies, but it is not everything.
3. BOLL - Bollinger Bands +
The Bollinger Bands indicator is a path indicator, suitable for beginners, and is used in volatile markets. It consists of the upper, middle, and lower bands, with the range not fixed and changing with coin price fluctuations.
The coin price is between the upper and middle bands, with the upper band as resistance and the middle band as support. Similarly, when the coin price is between the middle and lower bands, the middle band serves as resistance, and the lower band serves as support.
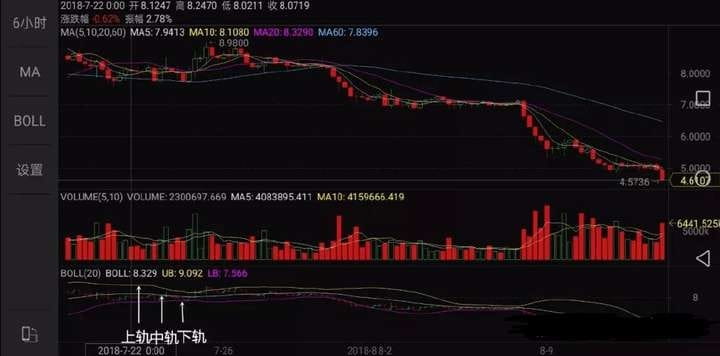
Bollinger Bands also have flaws; when a trend forms, Bollinger Bands may not be accurate. At this time, it is suitable for the five-day line strategy.
4. MACD - Moving Average Convergence Divergence.
It consists of a white line and a yellow line. When the white line crosses above the yellow line from below, it is called a golden cross - a buy signal; when the white line crosses below the yellow line from above, it is called a dead cross - a sell signal. When a large trend forms, MACD is relatively useful and suitable for trending markets.
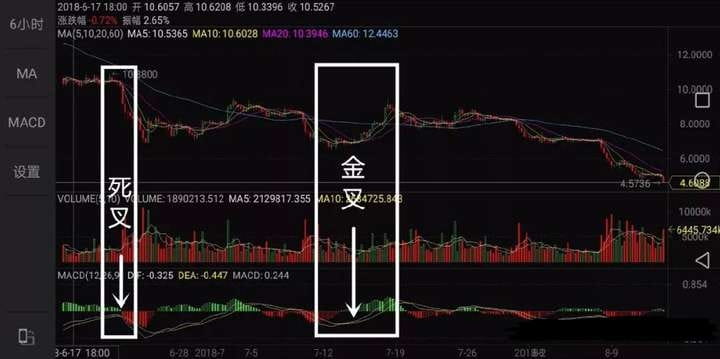
The MACD moving average indicator is stable and can provide an objective reflection of market momentum, with longer periods resulting in more accurate trends. Disadvantages: MACD mainly reflects the medium to long-term trends in the market, and its reflection on the short-term price movements of cryptocurrencies has a lag.
5. MA5 - Five-day line strategy.
The last type of the five-day line strategy, taking the following chart as an example, where the white line in the K-line represents the 5-day line, also known as MA5. Usage: In a bull market, when the price retraces to the 5-day line, it is an opportunity to increase positions. In a bear market, when the price rebounds to the 5-day line, it is an opportunity to reduce positions. It can also be used for short-term trading, where the 4-hour MA5 similarly serves as a support/resistance level.
The above indicators 2, 3, and 4 will have certain lag, and when we are operating in the short term, we can use them as reference indicators but should not rely entirely on them. To make more accurate judgments, we also need to consider real-time trading volume and the five-day line strategy comprehensively.
Secret Two: From 8 million in debt to 20 million in profit, all thanks to this (the king of MACD indicators).
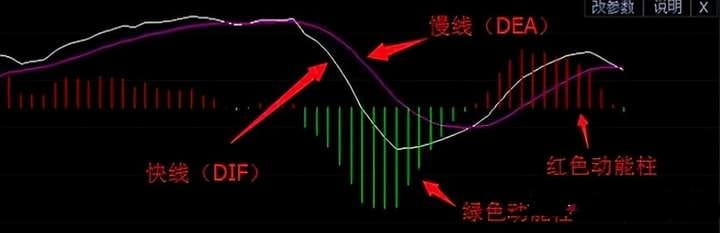
The MACD indicator (Moving Average Convergence Divergence) was created by Gerald Appel. It uses two long-term and short-term smooth moving averages to calculate the difference between the two as the basis for judging market buy and sell decisions.
MACD parameter settings:
Set parameters as 12-26-9, meaning the fast line DIF cycle is 12 days, the slow line DEA cycle is 26 days, and the average days for MACD is set to 9 days.
Application rules:
1. Both DIF and MACD are positive, meaning they are both above the zero axis, indicating a bullish market. If DIF breaks upward through MACD, a buy can be made.
2. Both DIF and MACD are negative, meaning they are both below the zero axis, indicating a bearish market. If DIF breaks down through MACD, a sell can be made.
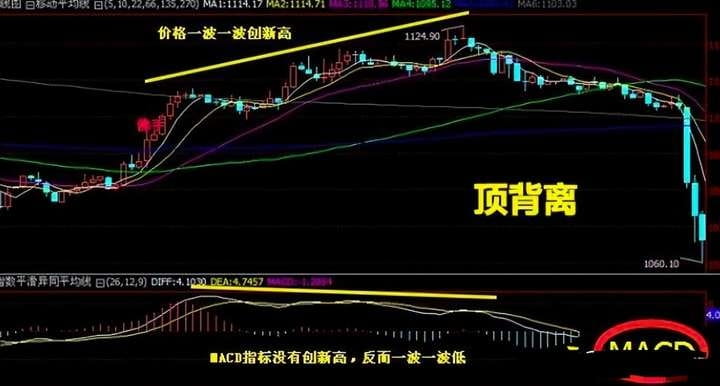
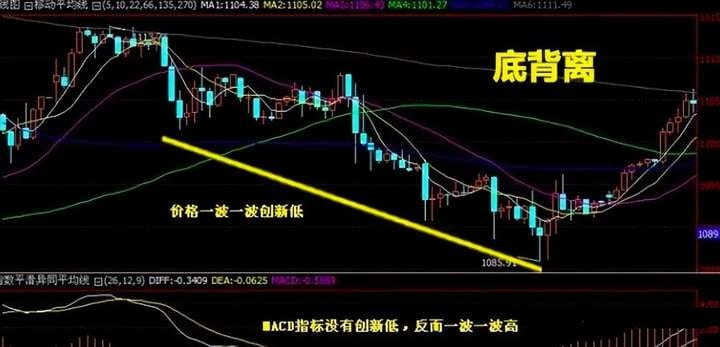
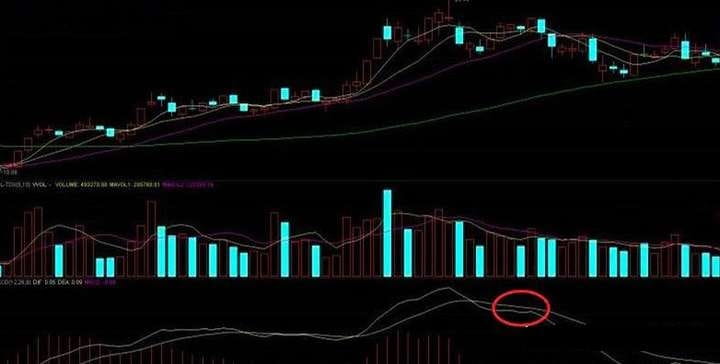
3. When the MACD line diverges from the K-line trend (the price shows recent low or high points but MACD does not accompany a new low or high), it is a reversal signal.
4. Analyze the DIF-MACD histogram; when it changes from positive to negative, it often indicates a market decline, and conversely, it often indicates a market rise.
5. When MACD is in a trading range, the error rate is relatively high, but if combined with RSI and KDJ, it can compensate for the shortcomings. When price changes rapidly, MACD will not produce signals immediately, and at that time MACD cannot take effect.
Buying and selling principles:
1. DIF and MACD are both above the O axis, indicating a bullish market. If DIF breaks up through MACD, a buy can be made; if DIF breaks down through MACD, only the original position can be closed; new sell orders cannot be placed.
2. DIF and MACD are both below the O axis, indicating a bearish market. If DIF breaks down through MACD, a sell can be made. If DIF breaks up through MACD, only the original position can be closed; new buy orders cannot be placed.
3. Bull divergence: When the price shows two or three recent low points while MACD does not accompany a new low, a long position can be considered.
4. Bear divergence: When the price shows two or three recent high points while MACD does not accompany a new high, a short position can be considered.
5. Two downward crosses at high positions lead to a big drop, while two upward crosses at low positions lead to a big rise. The MACD 'not quite a golden cross' selling method states that when the two MACD curves form a golden cross, the price will rise, which is common knowledge. However, sometimes the price may still rise after the two MACD curves form a dead cross at high positions, and it may even reach new highs, which can be confusing.
Why does the price rise after the MACD's two curves form a dead cross at high levels? We know that when a train is running at high speed, it cannot stop immediately after the brakes are applied; the huge inertia will cause the train to continue moving forward for a while before stopping. After the MACD's two curves form a dead cross, the price may still continue to rise, just like the inertia of a train, which is the inertia effect of a rising trend, the last push of a rising market. As the price continues to rise due to inertia, the DIF after the high-level dead cross will start to move up again and MACD is about to form a golden cross (not yet crossed), then DIF will turn down again, forming the “not quite a golden cross” pattern.
When the MACD's two curves form the 'not quite a golden cross' pattern, a new round of decline will occur in the future. The 'not quite a golden cross' pattern formed after the two MACD curves dead cross at high positions will trigger a new round of decline. Some investors do not understand this characteristic and mistakenly believe that the price's inertia upward after the MACD dead cross indicates the beginning of a new significant upward trend, leading to a chase high buy, ultimately getting trapped in a 'bull trap' at high positions. In practical operations, we only regard the upward movement after the MACD high-level dead cross as an inertia surge and adopt a quick in-and-out strategy to avoid falling into the 'bull trap'. After DIF forms 'not quite a golden cross' and begins to turn down, one should sell long positions.
Investment skills: Techniques for buying and selling operations using MACD.
The MACD indicator is the most classic technical indicator among all technical indicators. When used correctly, in conjunction with K-lines (daily, weekly), product trends, trading volume, and the broader environmental context, as well as news of positive and negative events, one can generally achieve better buying and selling results. In actual investment, the MACD indicator not only has the function of bottom fishing (divergence indicates a bottom), capturing very strong upward points (buying when MACD turns positive twice), and capturing 'end of washout opportunities' (buying on divergence), but also helps you catch the best selling points and successfully escape the peak (or bottom).
1. Use the method of buying long positions on two golden crosses at low levels with MACD.
The MACD indicator utilizes two smooth moving averages (long-term MACD and short-term DIF) and calculates the difference between the two (DIF-MACD) as the data for the length of the red and green columns. The main consideration is the crossover situation of the long and short-term moving averages and the length values of the red and green columns, using this as the basis for judging market buy and sell decisions.
In actual use, investors may feel that if they completely buy on golden crosses and sell on dead crosses, it is difficult to profit or they may even incur losses. Therefore, a method of buying on two golden crosses at low positions can be used.
When the MACD has its first golden cross at a low position, the price often has limited upward movement or may rise slightly before experiencing a significant pullback, causing investors who bought in to suffer losses. However, when the MACD forms a second golden cross at a low position, the probability and magnitude of price increases will be greater. This is because after the first golden cross, the indicator experiences a slight pullback and forms a dead cross, making it seem like the bears are taking control again, but in fact, this has already reached the end of the bears' strength. Thus, when the indicator forms a second golden cross, it will inevitably trigger a strong bullish movement.
Usage method:
As the price rises, MACD turns positive, meaning the white line crosses above the yellow line (do not buy just yet). Afterward, as the price falls back, DIF (the white line) closes in on MACD (the yellow line). When the white line and yellow line are close together (ready to turn green but not yet), one only needs to align with the daily K-line. If there is a sign of a stop in the K-line, such as a bullish close or a doji, it is considered 'bottom divergence'.
Bottom divergence is the best time to buy long positions (or sell short positions)! Conversely, when the price pulls back at a high level, MACD turns negative, and then rebounds; when DIF (the white line) and MACD (the yellow line) are close together (ready to turn red but not yet), if there is resistance, such as a bearish close or a doji, it could indicate a 'top divergence' and is the last good opportunity to sell long (or buy short)! At this time, many people mistakenly believe that the upward trend has resumed, and buying long positions at others' best selling points often leads to being trapped.
But be careful during operation:
a. During divergence, do not consider whether it breaks through or surpasses previous high (low) points.
b. At high positions, as long as there is a top divergence, it is generally best to sell; do not bet on a strong reversal unless a significant bullish candle appears.
C. It is an excellent tool for finding short-term buy and sell points, with short-term fluctuations of over 15%, but the medium-term trend must be considered in conjunction with long-term patterns and others.
2. Using MACD to capture the best long position selling points.
Its meaning refers to a relative high point formed after a significant price rise followed by sideways movement. Investors, especially those with substantial funds, must sell at the first selling point or reduce their positions.
The technique for judging the establishment of the 'first selling point' is 'price consolidation, MACD dead cross selling.' This means that when the price undergoes continuous rises and then enters consolidation, while the 5-day and 10-day moving averages have not yet formed a dead cross, but MACD dead crosses first, the day of the dead cross becomes the moment when the 'first selling point' is established, and one should sell or reduce long positions.
After the first selling point is formed, some stocks do not experience a significant drop but instead pretend to break upward after a pullback to disguise selling, with the main bullish force making a final push before unloading, also known as a false wave rise. The high point formed at this time often becomes the peak of a bull market, which is why it is also called the absolute top. If long positions cannot be smoothly exited at this time, the consequences are unimaginable.
The technique for judging the absolute top is 'price and MACD divergence selling', which means when the price rises sharply to create a new high, but MACD fails to create a new high in sync, the two trends diverge, which is a clear signal that the price has peaked. It must be noted that when selling long positions at the absolute top, one must never wait for MACD to dead cross before selling because by the time MACD dead crosses, the price has already dropped significantly. When selling at a false peak, one must refer to the K-line combinations.
Generally, during a sharp rise in a false wave, if a 'high open low close' bearish candle or 'long lower shadow bullish candle' appears, it is an excellent selling opportunity. Finally, it is important to remind that due to the lag of the MACD indicator, using MACD to find the best selling point to escape the peak is particularly suitable for those cryptocurrencies that have significantly risen and then formed a consolidation; it is not suitable for those that have rapidly surged and then dropped.
Additionally, the above two points mostly occur after a significant market rise, meaning they appear after the main upward wave of the market. If a cryptocurrency has not significantly risen and has not gone through a major upward wave, do not use the above methods.
The above are some of Yan An's views and insights. If you find them helpful, you can like and save them. I am Yan An, someone who has experienced three cycles of bull and bear markets, skilled in logical coin selection and technical timing, only trading within my cognitive range. Every direction I take has been confirmed by the market!
No matter how diligent a fisherman is, he will not go out to fish in stormy weather but will carefully guard his fishing boat. This season will eventually pass, and a sunny day will come! Follow Yan An, who teaches you both the fish and the fishing skills. The doors of the cryptocurrency world are always open; only by following the trend can one have a life of harmony.

